
Key Takeaways
- Davis Select Worldwide ETF (DWLD) posted a strong return of +24.20% in 2024, substantially outperforming its MSCI ACWI (All Country World Index) benchmark.
- We believe China may be starting to emerge from its long economic slump following the government’s more aggressive stimulus measures in late-2024. Retail sales are improving, property prices appear to be stabilizing and GDP growth has strengthened.
- As we position the portfolio for the emergence of AI, we find opportunity among established market leaders with proven business models that are either using AI to improve a large existing platform or are key semiconductor players helping to build out the AI ecosystem.
- While high market valuations remain a key investment risk, our portfolio has been built to emphasize durability and resilience. We focus on competitively advantaged companies with strong managements trading at attractive valuations that can be expected to produce good results through shifting economic conditions.
The average annual total returns for Davis Select Worldwide ETF for periods ending December 31, 2024, are: NAV Return, 1 year, 24.20%; 5 years, 8.67%; Inception (1/11/17), 9.16%; Market Price Return, 1 year, 24.35%; 5 years, 8.67%; Inception, 9.18%. The performance presented represents past performance and is not a guarantee of future results. Investment return and principal value will vary so that, when redeemed, an investor’s shares may be worth more or less than their original cost. For the Fund’s most recent month end performance, visit davisetfs.com or call 800-279-0279. Current performance may be lower or higher than the performance quoted. NAV prices are used to calculate market price performance prior to the date when the Fund was first publicly traded. Market performance is determined using the closing price at 4:00 pm Eastern time, when the NAV is typically calculated. Market performance does not represent the returns you would receive if you traded shares at other times. The total annual operating expense ratio as of the most recent prospectus was 0.63%. The total annual operating expense ratio may vary in future years.
This material includes candid statements and observations regarding investment strategies, individual securities, and economic and market conditions; however, there is no guarantee that these statements, opinions or forecasts will prove to be correct. All fund performance discussed within this material are at NAV and are as of 12/31/24, unless otherwise noted. This is not a recommendation to buy, sell or hold any specific security. Past performance is not a guarantee of future results. The Attractive Growth and Undervalued reference in this material relates to underlying characteristics of the portfolio holdings. There is no guarantee that the Fund performance will be positive as equity markets are volatile and an investor may lose money.
Performance
Davis Select Worldwide ETF (DWLD) posted a strong return of +24.20% in the year ended December 31, 2024, substantially outperforming the +17.49% return of the MSCI ACWI (All Country World Index). In this report, we discuss factors that contributed to the fund’s good performance, along with any underperformers during the same period.
Contributors to Performance
DWLD’s holdings in Chinese consumer-facing companies were major contributors to the fund’s 2024 outperformance. Meituan was the largest contributor—its shares rose 86% over the year. This leader in food delivery is enjoying strong growth in its core local commerce business while maintaining good cost discipline. In the third quarter of 2024 revenues in this segment were up 22% while operating profits grew 44%. Meituan has competitive advantages in both its food delivery business, where it has taken share from Alibaba’s ele.me, and its in-store business, where it has successfully fended off an incursion from Bytedance.
We invested in Trip.com, the largest online travel agency in China, in the third quarter of 2024 and its shares rose 66% by year-end. The Chinese continue to show a strong desire to travel both domestically and abroad. In the third quarter of 2024 Trip.com’s revenues were up 16% and operating profits were up 28%.
Naspers and Prosus shares returned 30% and 34%, respectively, in 2024, driven by their 24% ownership of Tencent. Tencent is the world’s largest video game company and the messaging and social media leader in China. Revenues in Tencent’s video game and advertising sales segment grew 8% in the third quarter of 2024 and earnings were up 18%, pushing operating margin to over 30%.
Large U.S. internet companies were also major contributors to DWLD’s performance in 2024. Meta shares rose 66% over the year as the company saw strong advertising sales and user engagement. As with Meituan, Meta’s founder-led culture is maintaining good cost discipline while also enjoying strong revenue growth, leading to expanding operating margins. Meta is also proving to be one of the biggest beneficiaries of artificial intelligence (AI). It uses AI to improve content suggestions, leading to higher user engagement, and to sharpen ad targeting, leading to higher ad revenues per user. One product to watch going forward is Meta’s Orion augmented reality (AR) glasses which enable a digital experience in the physical world with a comfortable form factor. While still a new technology, Orion is an example of Meta’s willingness to innovate to create the next computing platform.
Amazon and Alphabet stock prices rose 44% and 36%, respectively, in 2024 as e-commerce, advertising and cloud computing performed well, increasingly supported by advances in AI.
The financial services sector was a major contributor to fund performance as well. Shares of U.S. credit card and banking leader Capital One rose 38% in 2024 as the credit card business performed well, with continued loan growth and low loan losses. The company also benefited from rising expectations that its acquisition of Discovery Financial Services would be approved, given a potentially friendlier regulatory environment under the new U.S. administration.
Ping An Insurance Group shares returned 41% in 2024 due to strong growth in the life insurance business and the fact that the company offers a 6% dividend yield while trading at only 5x owner earnings.
Shares of U.S. insurer and conglomerate Berkshire Hathaway returned 27% in 2024. Berkshire’s property and casualty insurance business performed well in a good pricing market and subsidiary GEICO (auto insurance) appeared to be in the process of turning its business around. At the same time the company has sold down large stakes in Apple and Bank of America to raise cash on the balance sheet to $325 billion as of September 30, 2024, and position its portfolio defensively.
Detractors from Performance
Samsung was the biggest detractor from results in 2024 as its shares fell 39% over the year. Investors were expecting a rebound in 2024 after a cyclical decline in 2023 but weakness in Samsung’s traditional memory markets and an inability to get qualified in high bandwidth memory (HBM) for AI chips by Nvidia led to some disappointing results. On the other hand, we expect Samsung to finally work with Nvidia in 2025 and grow its share in HBM from 40% to about 50%, regaining leadership in the sector from Korean semiconductor company SK Hynix. Samsung was trading at only 7x estimated 2025 owner earnings in January 2025. We believe its strong memory chip market position and solid second-place ranking in the semiconductor foundry business is dramatically undervalued.
MGM Resorts stock was down a disappointing 22% in 2024, mainly due to execution issues in the online BetMGM sports gaming joint venture, which led to loss of market share. A subsequent change in management and improved execution, however, has stemmed the share loss and positioned MGM’s online operations to take advantage of the big potential in online gaming. MGM was trading at only about 10x owner earnings in January 2025 despite having assets like the best gaming properties in Las Vegas, a possible casino license in New York City and a stake in a very large casino development in Osaka, Japan, not to mention the growth potential of online gaming. All this bodes well for future profit expansion.
Finally, shares of U.S. health insurer Humana declined 32% since we purchased in January 2024 due to an industry-wide spike in healthcare costs and a markdown in the company’s Medicare Star Ratings for 2025 which will likely lead to a drop in earnings in 2025 and 2026. Humana intends to adjust its plan offerings for the higher costs and loss of Star Rating bonuses but we forecast it will take a couple of years for margins and earnings to recover. Looking beyond the next couple of years, though, Humana remains well-positioned in a growing Medicare Advantage market driven by an aging population with a rising preference for the privately managed Medicare plans.
Market Perspectives:
No Letup in Valuation Risk
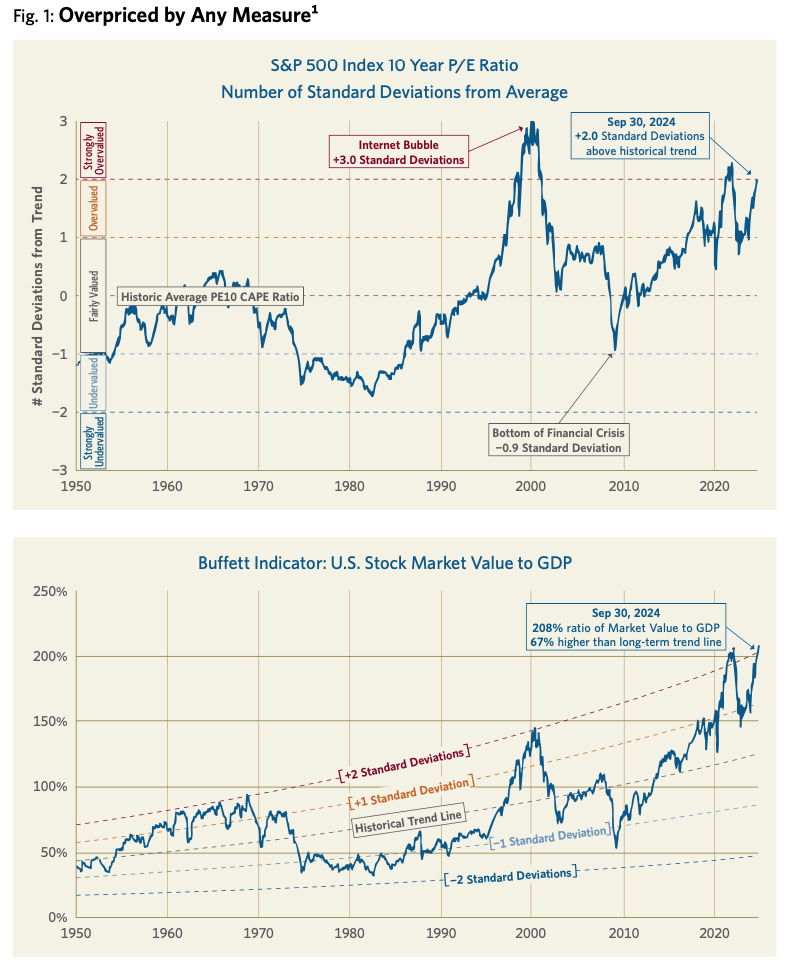
High stock market valuations continue to be a major risk facing investors today. As seen in Figure 1, the price/earnings (P/E) ratio of the S&P 500 Index was around two standard deviations above its historic average towards the end of 2024. At the same time, U.S. stock market value as a percentage of total U.S. gross domestic product—the so-called Buffett Indicator—was near its highest level in history.
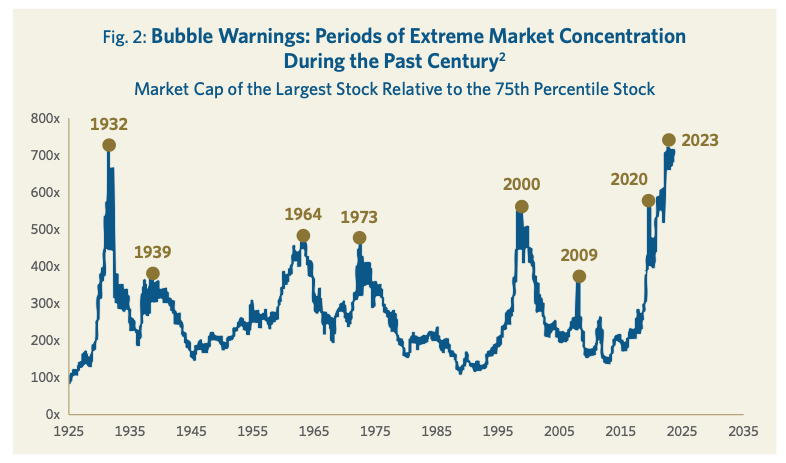
A key driver of high market valuations is the extreme level of concentration in a few large highly valued companies. By some measures, the market is at its highest level of concentration in the past century. In the past, such concentration has tended to be a warning sign of a stock market bubble (see Figure 2).
By selectively investing in competitively advantaged companies run by experienced and talented managers, and purchasing these companies at attractive valuations, Davis Advisors has consistently grown wealth for its investors since its founding over five decades ago. In the case of DWLD, these timeless investment principles have resulted in a portfolio that has average earnings growth in excess of its MSCI ACWI benchmark alongside an average P/E valuation well below the benchmark (see Figure 3). We believe this selective portfolio of high quality companies trading at low valuations bodes well for future returns.
Fig. 3: Selective, Attractive Growth, Undervalued3
| DWLD | Index | |
| Holdings | 39 | 2,647 |
| EPS Growth (5 Year) | 23.0% | 16.6% |
| P/E (Forward) | 11.5x | 20.4 |
China:
Stimulus Takes Hold
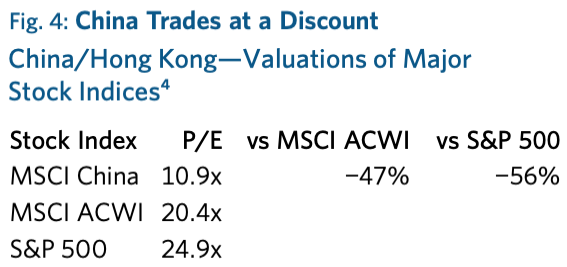
One opportunity for global investors today is to take advantage of lower valuations amongst international companies. China’s valuation discounts are among the largest. The MSCI China Index was trading at a 47% P/E discount to the MSCI ACWI and a 56% discount to the S&P 500 Index in December 2024 (see Figure 4). However, many of these Chinese companies are high-quality, profitable and well-run businesses with strong growth outlooks operating in the world’s second largest economy. Over the past 2–3 years Chinese companies have also been returning significant amounts of cash to shareholders via dividends and share repurchases.
The ability of the Chinese economy to reach the government’s stated goal of achieving GDP growth of “about 5%” was in question for much of 2024. However, in September 2024 the central government announced a major economic support package. To bolster the property market, the People’s Bank of China (PBOC), China’s central bank, cut the mortgage rate by 0.5% and lowered the minimum down payment on second homes from 25% to 15%, matching the already lowered level for first-time home purchases.
The central bank further announced it would fund a RMB 300 billion loan initiative to allow state-owned enterprises to buy unsold properties and turn them into affordable housing units. It also cut a key short-term lending rate and reduced the reserve requirement ratio for commercial banks, thereby releasing an additional RMB 1 trillion ($140 billion) of long-term liquidity into China’s financial markets.
China’s government additionally showed it was focused on supporting the stock market by establishing a RMB 500 billion ($70 billion) lending facility to financial firms to buy stocks. An additional RMB 300 billion ($40 billion) will be lent to corporations to repurchase their own shares.5
Two days after the PBOC announced these measures, the Politburo demonstrated that it saw the need for rapid and meaningful economic stimulation by moving an important economic meeting originally scheduled for December 2024 up to September. In this special meeting the Politburo announced the issuance of RMB 2 trillion of sovereign bonds to support consumption and help local governments tackle their local debt challenges. Measures to boost consumption included help for enterprises to upgrade large-scale business equipment and the provision of a monthly allowance of RMB 800 billion ($114) per child to households with two or more children.6 Later, in December 2024, the government followed up by announcing that it would increase the sovereign bond issuance to RMB 3 trillion ($411 billion), and would include funding to companies investing in advanced innovation-driven economic sectors.7
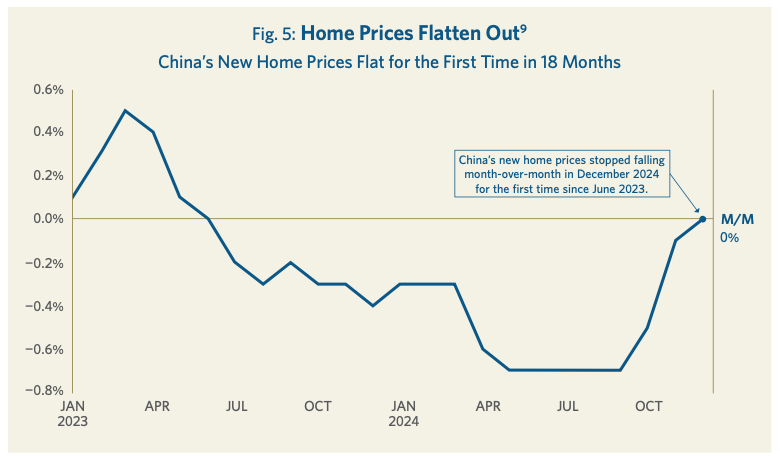
It is still early days and many of the details of the announced economic stimulus programs will have to wait for the annual parliamentary meetings in early March, known as the “two sessions.” However, the stimulus programs are already having a positive impact. China’s annualized GDP growth in the fourth quarter of 2024 was a strong 5.4%, pushing the growth rate for the full year to 5.0%. Importantly, the property market seems to be stabilizing. Developers sold 4% more residential floor space in December than the year before, the second monthly increase in a row.8 Real estate prices also seemed to be stabilizing. Price declines started narrowing in October and November 2024, and in December, for the first time in 18 months, prices were flat month-over-month (see Figure 5).
Retail sales, while still relatively sluggish, have started to improve as well, averaging 3.8% year-over-year growth in the fourth quarter of 2024 compared to 2.7% growth in the third quarter.10 Should Chinese consumers regain confidence that the real estate market has stabilized and that economic growth will remain on track, their high propensity to save gives them pent-up spending power which could lead to strong consumption growth. The net increase in savings as shown by household bank deposits since 2020 has been over $9 trillion which is more than all China retail sales in 2023.11
The companies we visited on a trip to China in December 2024 were optimistic about the government’s economic stimulus efforts. One reason was that the Politburo, chaired by President Xi, is being very vocal in its support for the stimulus plan.
The central government has the balance sheet to support a major stimulus plan and President Xi has the ability to craft and implement it. The fact that it was the Politburo that enacted the September stimulus was seen as increasing the odds it would be effective and large enough to be successful. Early in 2025 the government continued to announce measures to support growth and the domestic stock market. On January 22, the China Securities Regulatory Commission (CSRC) and the PBOC announced that state insurers will have to invest a minimum of 30% of their new policy premiums in local shares while mutual funds need to increase their local shareholdings by 10% annually for the next three years. Estimates are that the additional flows into the equity market could total RMB 470–530 billion ($65–74 billion) in 2025 alone.12
Despite the “green shoots” seen in the fourth quarter of 2024, the Chinese economy faces a number of challenges. Near-term challenges include the threat of higher tariffs on Chinese exports to the U.S. China’s exports to the world grew approximately 13% to nearly $1 trillion in 2024, a major reason why the country achieved 5% GDP growth that year. Exports accounted for an estimated 20% of GDP in 2024.13 The U.S. remains China’s largest trading partner but its share of China’s exports had fallen to 15% in 2023 from 19% in 201814 and exports to the U.S. account for only 3% of China’s GDP. China will possibly be able to replace any decline in exports to the U.S. with sales to other countries. Even if it cannot, the impact on its economy will likely be manageable. The consumer-focused stimulus plans will be important in offsetting any possible exports weakness in 2025.
A longer-term challenge is how to address local government debt problems, which is the purpose of the announced RMB 1 trillion sovereign bond issuance. Aging demographics are also a concern. China’s overall population growth has declined at a rate of -0.03% per year over the last five years. Urban population, however, is still growing, rising 1.3% per year over the past five years as the one-third of the population still living in rural areas migrates to the cities.15 Urban residents are the key consumers and employees for our portfolio companies. Over the next decade, China’s total population is forecast to remain largely flat although aging will likely lead to a slowly declining workforce.16 Urbanization, a rise in the currently low retirement age, and increased automation are some of the factors that could help offset the impact of the aging population.
Positioning the Portfolio for AI
It has been more than two years since the public launch of OpenAI’s ChatGPT in November 2022, but excitement around generative AI (GenAI) remains pervasive among the management teams we engage with and in the broader markets. Investment in GenAI—and AI more broadly—continues to accelerate, benefiting key technology suppliers in the AI tech stack, such as GPU-maker Nvidia. On the applications side, progress is evident with GenAI-first apps like ChatGPT achieving ever-wider adoption (by December 2024, 300 million ChatGPT weekly users were sending over one billion messages per day).17 GenAI features are proliferating across the largest consumer platforms, including Google Search, Instagram and Amazon.
The pace of AI innovation remains rapid. Over the past year several new companies have demonstrated the ability to build frontier-level large language models (LLMs), raising questions about the long-term competitive moat around LLM development. Simultaneously, debates have emerged about whether advancements in LLM training are reaching a plateau. We have also seen how innovations in inference computing are driving impressive improvements in LLM reasoning capabilities. We believe the fast-evolving nature of this industry reinforces the importance of being patient and selective in identifying, and building conviction in, businesses that could generate the long-term profits needed to justify their current valuations.
In the application layer, we continue to believe large incumbents with established distribution and data advantages are well-placed to incorporate GenAI into existing and new business models. As such, Meta remains one of our largest holdings in the portfolio. Meta’s strong financial performance in 2024 was largely driven by AI investments in content and advertising ranking and in recommendation algorithms. The company reports that AI-driven improvements in feed and video recommendations directly increased time spent on Facebook and Instagram by 8% and 6%, respectively, in 2024. We see a long runway for further AI improvements to increase user engagement and advertising efficiency over time. On the GenAI front, Meta is realizing business benefits by offering GenAI tools to advertisers, enabling them to create higher-converting ads. In addition, the company has seen promising initial traction with its Meta AI assistant, which had nearly 600 million monthly active users as of end-2024, according to Meta. Overall, we continue to see a company executing at a strong pace that is well-positioned to successfully leverage AI across its product portfolio.
Tencent (owned via our investments in Naspers and Prosus) is another company we continue to favor in the application layer. Tencent’s profitable and growing social media, messaging and video gaming businesses all stand to benefit from AI. Within its social media platforms, we expect Tencent to see meaningful gains from AI-driven ranking and recommendation improvements, particularly in Video Accounts, the short-form video product that has become a core use case within WeChat. Similar to Meta, we expect a long runway for Tencent’s GenAI capabilities to improve ad creative and performance, and increased monetization over time. Tencent’s massive distribution advantage through WeChat positions it well for any breakthrough GenAI products. For instance, in search, which is doubling revenues year-over-year, Tencent is already finding success in leveraging GenAI technology to capture significant market share.
We also previously identified hyperscale cloud providers as long-term beneficiaries of the widespread adoption of GenAI. Our investments in Amazon (with its AWS cloud platform) and Alphabet (with GCP) provide exposure to leading cloud providers that play a critical role in enabling customers to build, deploy and run GenAI applications. Both Amazon and Alphabet saw revenue growth in their cloud businesses accelerate in 2024, at least in part due to new AI workloads. The importance of data in AI development and usage is accelerating the migration of core data repositories to the cloud where they can be more effectively accessed and organized. AWS’s AI business has surpassed $2 billion in annualized revenue, growing over 100% year-over-year in 2024. Use of Bedrock, AWS’s core AI application building service, jumped by 5x in 2024.
Despite its smaller size relative to peers and Alphabet’s overall business, we believe GCP is well-positioned to excel in an increasingly AI-driven world. GCP benefits from Alphabet’s technical leadership in AI, spanning models, infrastructure and research. Enterprise usage of GCP’s proprietary foundation model increased 14x over the six months to September 30, 2024. Cloud revenue growth accelerated by six percentage points in the third quarter of 2024, rising to 35% year-over-year versus 29% the previous quarter. Outside of GCP, we are also encouraged by Alphabet’s improved pace of execution amid increased competition and see multiple areas where GenAI could benefit its search and advertising businesses. In addition, the company’s steady rollout of commercial robotaxi operations suggests that it is making promising progress in turning its autonomous driving venture into a real business.
At a recent AWS event we attended, CEO Matt Garman estimated that at the present trajectory, within two-to-three years a single datacenter running an AI workload could well require as much as five gigawatts of power per day. This is roughly equivalent to the daily power consumption of a medium to large city. The entire state of Texas, for instance, hit peak daily consumption last summer of 85 gigawatts. Adding an incremental datacenter would be like suddenly introducing a power draw the size of Austin or El Paso to the existing power grid.
We see investment opportunities in some of the workhorse technologies that could flatten the trajectory of this steep incline in power consumption. One area that we believe remains attractive is semiconductor memory, traditional DRAM but particularly high-bandwidth memory or HBM. AI workloads cannot run on conventional memory because the transfer rate (or bandwidth) is too slow. Compared to standard DRAM, HBM has a 10x faster transfer rate because these memory chips along with the logic tiles (GPU, CPU, TPU, etc.) are physically connected to a larger silicon die (interposer).
These multi-chip systems provided one of the key breakthroughs that enabled LLM training and agentic computing in the first place. Their deployment— which extends beyond AI datacenters—significantly reduces power consumption, improves performance and reduces the server footprint. HBM features a much shorter data path between the host processor and memory which significantly reduces latency and the amount of time the server requires to complete each task. A denser server footprint lowers the significant cost of cooling the servers. Completing the same tasks with fewer, densely packed servers and being able to run larger workloads in each datacenter reduces the power that each processing task requires. The economics of datacenters boils down to data throughput per watt and the 10x faster transfer rate of HBM has been a game-changer.
Those wanting to compete in the emerging HBM market face higher barriers to entry than in the overall memory market because these memory chips must be qualified by the company that designed the logic chip (Nvidia, AWS, Google, Intel, AMD, etc.). Each HBM customer has specific performance and power consumption requirements unlike anything we’ve seen before in the memory market. Today the marquee account in HBM is Nvidia and its primary supplier is SK Hynix. However, we anticipate that the market leader in memory, Samsung, will qualify as a second supplier to Nvidia in 2025. Samsung was trading at just 7x estimated 2025 owner earnings per share in January 2025. We see its risk-reward profile as very favorable given that the company is among the global leaders in essential AI technologies like HBM (40% market share) as well as providing semiconductor foundry and advanced chip packaging services for third-party fabless chip companies (16% market share).
Our longstanding investment in the largest semiconductor equipment vendor, Applied Materials, predates the GenAI investment mania. However, GenAI’s emergence has proven to be an accelerant for the company’s core technologies, especially advanced packaging for HBM and multi-chip (tile) integration. The use of new materials and the increase in processing steps required to manufacture chips at three nanometers and below expands Applied Materials’ addressable market and increases its market share. New transistor structures and power-distribution systems will each draw heavily on Applied Materials’ unique expertise in depositing and etching these features. The die size of the individual tiles that form the GPU continues to get larger, meaning that more production tools are needed just to produce the same number of GPUs from one generation to the next. GPU volume for training alone probably needs to more than double next year to train the 10 trillion parameters anticipated for OpenAI’s GPT5.
The demands being placed on Applied Materials’ customers are driving significant collaboration and co-optimization which is solidifying and expanding the company’s competitive advantages. In 2025, Applied Materials plans to expand its global EPIC center (equipment and process innovation and commercialization) in Santa Clara, California, to develop the next generation of advanced packaging in partnership with its customers. Other technologies like Gate-All-Around (GAA) and a new novel power distribution technology called Back-Side Power, both developed at EPIC, are going into volume production in customer fabs next year. This is expected to increase the company’s available annual market from about $12 billion to $14 billion for every 100,000 wafers produced. We expect Applied Materials to generate about $9.50 of owner earnings per share this year (16x), and see terrific value in our investment in this company.
We continue to find attractive established market leaders in technology with proven business models that are able to take advantage of the opportunities in AI. These are either using AI to improve a large established platform, such as Meta, Tencent and Amazon, or are key players in the semiconductor space helping to build out the AI ecosystem, such as Samsung and Applied Materials. All have very profitable businesses that are further enhanced by advancements in AI.
Portfolio Holdings
Trip.com
Founded in 1999 and publicly listed in 2003, Trip.com owns the leading online travel agency (OTA) brands in China, Ctrip and Qunar, in addition to two key international travel businesses, Dublin-based Skyscanner and Singapore-based Trip.com. The company also owns just under 50% of publicly listed MakeMyTrip, India’s largest OTA. Through the company’s various platforms, business and leisure travelers can search and book all types of travel-related services, including flights, trains, hotels, car rentals, packaged tours, etc. With strong brand recognition, especially among consumers in China’s Tier 1 and Tier 2 cities, comprehensive selection, and a reputation for excellent customer service, the company’s core domestic brand Ctrip has established itself as the go-to travel platform for China’s rapidly growing number of travelers.
Trip.com makes money by taking a commission from each transaction booked on its platform. Accommodation reservations make up 40%+ of total revenues and an even greater share of profits. The accommodations industry in China is particularly attractive given its relatively low online penetration rate and low hotel chain penetration. Transportation ticketing accounts for 38% of revenues but has meaningfully lower profitability and is primarily used as low-cost customer acquisition for the rest of the platform. Trip.com has a robust outlook in domestic travel but we are also excited about its long-term growth prospects in China’s outbound travel market (Chinese citizens traveling abroad) and its fast-growing international business, primarily focused on Asian markets outside of China. In aggregate, the portion of Trip.com’s businesses touching international markets already accounts for approximately 35% of revenues and is poised to grow rapidly over the next few years.
Although shares have appreciated meaningfully since we bought Trip.com, we believe that valuation is still reasonable at 24x 2025 and 20x 2026 owner earnings, given the company’s strong competitive position and long runway to compound earnings growth. Key risks include renewed competitive intensity from formidable platform players like Meituan and ByteDance, geopolitical tensions that could reduce outbound travel demand or jeopardize the company’s investments in other jurisdictions (e.g., its stake in MakeMyTrip), and further macroeconomic weakness hurting discretionary travel demand.
CVS Health
CVS Health is a U.S. healthcare services company with approximately $370 billion in revenue. Key end markets include health insurance/benefits (approximately 27m Medicare/ Medicaid/ ACA/commercial members, under the Aetna brand), pharmacy benefit management (PBM) (approximately 90m members and approximately 1.9 billion drug scripts/year, under the Caremark brand), retail pharmacy (over 9,000 CVS retail locations in the U.S.), and a small but growing business in primary care (approximately 225 Medicare-focused clinics under the Oak Street Health brand).
We saw an opportunity to purchase CVS shares for an attractive price in late 2024 after a stretch of poor performance in its Aetna health insurance business (driven primarily by an unexpected industry-wide uptick in medical costs occurring just when Aetna was trying to aggressively grow its membership). We believe the new management (including a new Aetna leader with relevant prior experience at UnitedHealth) is in the process of fixing the poor performance in the insurance segment. The company has shifted its focus from member growth to margin gains amid an overall health insurance market that is showing signs of greater discipline. We believe this bodes well for future performance in the Medicare Advantage book in particular, which should see a further lift in 2026 due to improvements in quality/satisfaction, as per recently released Star Rating measures.
We estimate we purchased CVS shares for approximately 6–7x 2027 owner earnings, based on our expectation that insurance margins should return to normal ranges by then. While CVS faces a variety of risks, including reimbursement and competitive pressures at the retail pharmacy, PBM regulatory risk (with several new regulations being debated in Congress), and a large debt load, we believe this price offers an attractive risk-reward, all things considered, and the company’s diversified cash flow helps mitigate potential risks.
Entain Plc
Entain is one of the world’s largest sports betting and gaming groups. It operates in 30 countries and has a leadership position (#1–3 market share) in the five largest regulated markets (U.S., U.K., Australia, Italy, Germany) and the two fastest growing ones (U.S. and Brazil). Its key brands are Ladbrokes, Coral, BetMGM, Bwin, BetCity, Sportingbet and TAB. Some 30% of Entain’s business is retail—corner stores where people place in-person bets. We expect this business to grow by low single digits on an annual basis and achieve a 20% EBITDA margin in time. The remaining 70% of Entain’s business is online. Here we expect annual growth in the high single to low double digits and EBITDA margin close to 30% over time.
Gaming industry revenues had a 13% CAGR in the 12 years from 2011 to 2023, growing to $132 billion annually. Entain expects continued annual growth in the double digits. It also expects that growing scale and operating leverage will lead to rising margins. Entain has had some execution issues and management turnover, however—this in fact allowed us to start our position in the company at an attractive valuation. Entain was trading at an estimated 9x 2026 earnings in January 2025. Key risks include adverse regulatory changes in the gaming industry, tough competition in the online space and a possible recession.
Outlook:
Durability and Resilience
In a year when the U.S. stock market galloped ahead led by the performance of a narrow segment of highly valued megacap technology companies, we are pleased that our value discipline not only kept pace but outperformed the market indices. The significant valuation discount that our portfolio trades at compared to our benchmark indicates that we did not sacrifice our valuation discipline to achieve strong results. Rather the combination of strong earnings growth and a low valuation led to strong investment gains.
We remain watchful for risks which include the high valuation of certain stocks, inflationary pressures, large government deficits and debt levels, geopolitical volatility and recession threats. However, our portfolio has been built with a focus on durability and resilience. It comprises competitively advantaged companies run by talented and experienced managers and trading at attractive valuations. We expect their strong balance sheets, cash generation power and adaptability to produce good results through shifting economic conditions.
For more than 50 years we have navigated a constantly changing investment landscape guided by one North Star: to grow the value of the funds entrusted to us. We are pleased to have achieved strong results thus far and look forward to the decades ahead. With more than $2 billion of our own money invested in our portfolios, we stand shoulder to shoulder with our clients on this long journey.18 We are grateful for your trust and are well-positioned for the future.
DWLD Davis Select Worldwide ETF
Annual Review 2025
Managers