
Key Takeaways
- Davis Select Worldwide ETF (DWLD) posted a strong return of +14.26% in the first six months of 2025, outperforming its MSCI ACWI (All Country World Index) benchmark.
- A diverse group of companies in financials, communication services, information technology and healthcare drove strong results.
- Chinese companies remain attractively valued and are increasingly at the forefront of cutting-edge industries.
- While high market valuations remain a key investment risk, our portfolio has been built to emphasize durability and resilience. We focus on competitively advantaged companies with strong managements trading at attractive valuations that can be expected to produce good results through shifting economic conditions.
The average annual total returns for Davis Select Worldwide ETF for periods ending June 30, 2025, are: NAV Return, 1 year, 25.80%; 5 years, 12.97%; Inception (1/11/17), 10.32%; Market Price Return, 1 year, 26.06%; 5 years, 12.98%; Inception, 10.33%. The performance presented represents past performance and is not a guarantee of future results. Investment return and principal value will vary so that, when redeemed, an investor’s shares may be worth more or less than their original cost. For the Fund’s most recent month end performance, visit www.davisetfs.com or call 800-279-0279. Current performance may be lower or higher than the performance quoted. NAV prices are used to calculate market price performance prior to the date when the Fund was first publicly traded. Market performance is determined using the closing price at 4:00 pm Eastern time, when the NAV is typically calculated. Market performance does not represent the returns you would receive if you traded shares at other times. The total annual operating expense ratio as of the most recent prospectus was 0.63%. The total annual operating expense ratio may vary in future years.
This material includes candid statements and observations regarding investment strategies, individual securities, and economic and market conditions; however, there is no guarantee that these statements, opinions or forecasts will prove to be correct. All fund performance discussed within this material are at NAV and are as of 6/30/25, unless otherwise noted. This is not a recommendation to buy, sell or hold any specific security. Past performance is not a guarantee of future results. The Attractive Growth and Undervalued reference in this material relates to underlying characteristics of the portfolio holdings. There is no guarantee that the Fund performance will be positive as equity markets are volatile and an investor may lose money.
Performance
Davis Select Worldwide ETF (DWLD) posted a strong return of +14.26% in the six months ended June 30, 2025, outperforming the +10.05% return of the MSCI ACWI. In this report, we discuss factors that contributed to the fund’s good performance, along with any underperformers during the same period.
Contributors to Performance
Contributors to DWLD’s performance were diverse and from several sectors, including financials, communication services, information technology and healthcare.
In financials, results were driven by Danske Bank (Denmark), which returned 53% in the first half of 2025, and Capital One, which returned 20%.
Danske Bank posted good results in the first half of 2025 (1H25) with continued modest growth, strong cost discipline and low charge-offs. The bank is overcapitalized—it has an 18.7% Tier 1 capital ratio compared to a requirement of 14.6% and a company target of 16%—so we are expecting strong shareholder returns. We anticipate a 10–12% shareholder return annually for several years through a 7–8% dividend yield combined with the repurchase of 3% of the shares. The Danish krone’s 12% appreciation relative to the U.S. dollar in 1H25 also benefited our portfolio. Danske Bank’s valuation remains attractive, in our view, at 8x 2026 owner earnings.
Capital One achieved strong results in 1Q25—revenues rose +6% year-over-year, driven by share gains in credit cards at attractive economics with credit charges stabilizing. The bank closed its merger with Discover in May, making the combined entity the nation’s sixth largest bank. We expect it to realize significant synergies through rationalization of overlapping costs and debit card network savings. Over time Capital One can build out the Discover credit card network on a global basis, creating real value. Like Danske Bank, Capital One is very overcapitalized and we expect meaningful return of capital to shareholders.
In communication services, Meta, the largest position in DWLD, returned 26% in the first half of 2025. Revenues and earnings rose by 17% year-over-year in 1Q25. Advertising remains the key business driver with ad impressions growing 5% and the price per ad rising 10% in the first quarter. User growth and engagement remain strong—daily active users were up 6% to an incredible 3.4 billion in the first quarter. Meta is investing heavily in artificial intelligence (AI) and plans to spend approximately $70 billion this year, mainly on data centers, and hiring some of the most sought-after AI talent. Given its growth opportunities Meta remains attractive at 27x 2026 owner earnings and 22x if we exclude the investment being made in the Reality Labs augmented reality/virtual reality (AR/VR) glasses platform. Short-term results are bound to be lumpy given the cyclical nature of advertising, but Meta’s continued growth in users, strong engagement and AI-driven growth opportunities position it well for the future.
Also in communication services, Chinese technology company NetEase gained 54% and Southeast Asia’s dominant e-commerce platform, Sea Limited, was up 51% in the first half of 2025. NetEase’s recently launched games have performed well, and strong cost discipline led owner earnings to grow by 38% year-over-year in 1Q25. Meanwhile Shopee, owned by Sea Limited, saw revenues rise 28% and earnings flip sharply positive in the first quarter of 2025 compared to last year when Shopee was still in investment mode.
The information technology sector was a solid contributor in the first half of the year, driven by a 24% return from Samsung Electronics and strong performance from U.S. mobile technology company AppLovin Corporation, which returned 41% from when we purchased it in March of this year.
Samsung revenues rose 10% year-over-year in 1Q25 as demand for memory chips remained strong and its handset business sold 61 million units during the quarter (compared to Apple’s 50 million) with good pricing. Uncertainty remains around tariff levels and export controls but Samsung, the world’s largest memory and handset manufacturer and second-largest semiconductor foundry, trading at only 9x owner earnings, remains attractive.
AppLovin is a new position that we started in March when the stock fell as the company faced allegations that it improperly used consumer data to improve advertising effectiveness, and that its ads were of poor quality. AppLovin has become the leading platform for in-game advertising. Advertisers are seeing strong returns on advertising spend, driving the company’s revenues and earnings up 40% and 110% year-over-year, respectively, in 1Q25. AppLovin continues to pass compliance audits by the Apple and Google app stores and advertisers are voting with their ad budgets that its platform is creating value, but we continue to monitor the situation and talk to industry participants.
Our holdings in the healthcare industry as well as in consumer discretionary were major contributors to results. CVS is a leading health insurer, pharmacy benefit manager and drug retailer where concerns around Medicare cost trends provided an attractive entry point in 4Q24. In 1Q25 CVS’ Medicare unit reported better cost trends than feared, leading to a 7% rise in revenues and 55% increase in profits. CVS returned 57% in the first half of 2025.
In consumer discretionary, both South African multinational Naspers and its operating entity, Prosus, returned 40% in the first half. Its main holding, Chinese multimedia company Tencent, saw revenues rise 13% and owner earnings up 15% year-over-year in 1Q25. Tencent’s video game business and its WeChat video accounts (short form videos like TikTok) saw good growth, enabling it to continue investing in AI by hiring talent and investing in data centers.
Online U.K. gaming company Entain Plc was another positive contributor in consumer discretionary, with its shares up 46% in the first half. Revenues in its international gaming operations were up 9% year-over-year in 1Q25. The standout performance came from BetMGM, its 50/50 joint venture with MGM Resorts International, where revenues rose 34% in 1Q25, led by strong results in its sports betting business. Company guidance is now for BetMGM to progress from a loss of $244 million in 2024 to earning at least $150 million in 2025.
Detractors from Performance
Viatris, an American pharmaceutical and healthcare company was a detractor from performance in the first half of 2025 with a -26% return. The closure of one of its manufacturing plants in India is a temporary setback. The company faced pricing pressure in Japan in 1Q25, somewhat offset by growth in China, leading to a 3% year-over-year revenue decline in the quarter, adjusted for divestitures and foreign exchange. Tariffs on pharmaceuticals in the U.S. are also a concern although only 10% of Viatris’ revenues come from U.S. sales of drugs sourced from foreign manufacturing facilities. Trading at 5x owner earnings, with a dividend yield above 5% and repurchasing 3% of its shares every year, Viatris remains attractive, in our view.
Meituan, the leading food delivery company in China, was down 18% in the first half of 2025 as competition from JD.com and Alibaba is expected to hurt profitability in 2025. Competition in the instant shopping space (fast delivery in under one hour) has spilled into food delivery. However, since Meituan’s competitors are relying on unprofitable consumer subsidies to take share, we expect the intensity of competition to eventually subside, as it did in other industries facing similar situations such as ridesharing, in-store marketing, online travel and e-commerce.
The leading Chinese online travel agency Trip.com Group was down 14% in the first half of 2025 as margins disappointed, mainly due to its increased investment in its international Trip.com app. Revenues grew a healthy 16% year-over-year in 1Q25, but operating profits only grew 7% instead of slightly improving, as is usual. However, we support management’s decision to sacrifice short-term profit margins to grow air ticketing and hotel room volumes (which rose 60% in 1Q25) to invest in the long-term health of the Trip.com platform.
Market Perspectives:
Be Selective, Stay the Course
The first half of 2025 was a very volatile period for equity markets. The S&P 500 Index hit all-time highs in January as investors were optimistic that the new Trump administration’s deregulation agenda would drive higher economic growth and corporate profits. In late January, however, the release of the Chinese DeepSeek AI model, R1, caused a big drop in technology stocks. DeepSeek showed an ability to create a leading-edge AI model with lower memory and computational resources. This led to concerns that investors had overestimated the number of semiconductors and data centers that would be needed for the broad AI rollout. Then in early April, the Trump administration unveiled much higher and more comprehensive tariffs than expected, leading to fears of renewed inflation, delayed interest rate cuts and weaker consumer spending. This caused the S&P 500 Index to fall a further 12% over four trading days.
On April 9, however, a 90-day pause in the highest tariffs was announced, shocking the S&P 500 Index into a 9.5% leap in a single day. As the market became more convinced that the highest tariff levels would not be implemented, including a 145% tariff on Chinese goods (which was also rolled back), the focus turned to the stimulative effects of the large tax cut passed by Congress. The net result was that over the first six months of 2025 the S&P 500 Index returned a positive 6.2%.
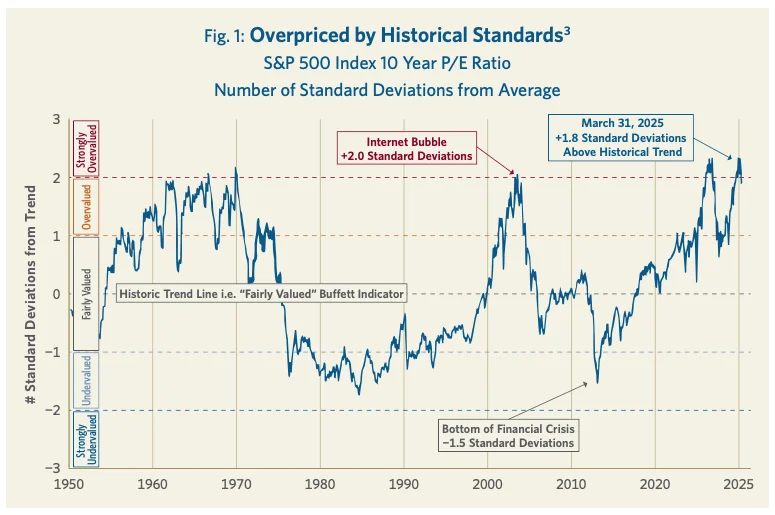
High stock market valuations continue to be a major risk facing investors today. A substantial part of these lofty expectations is tied to the technology sector broadly defined (information technology plus communications services). Combined, this was at an all-time high share of 42.9% of the S&P 500 Index’s market capitalization at the end of June 2025, higher even than the previous peak in February 2000.1
As seen in Figure 1, the price/earnings (P/E) ratio of the S&P 500 Index was almost two standard deviations above its historic average at the end of March 2025.
Although equity markets are trading at high valuations, DWLD portfolio companies’ average earnings growth exceeds that of its MSCI ACWI benchmark while the portfolio also has an average P/E valuation well below the benchmark (see Figure 2). By selectively investing in competitively advantaged companies run by experienced and talented managers, and purchasing these companies at attractive valuations, Davis Advisors has consistently grown wealth for its investors since its founding over five decades ago. We believe this selective portfolio of high-quality companies trading at low valuations bodes well for future returns.
Fig. 2: Selective, Attractive Growth, Undervalued2
| DWLD | Index | |
| Holdings | 38 | 2,528 |
| EPS Growth (5 Year) | 28.9% | 14.4% |
| P/E (Forward) | 12.6x | 19.4x |
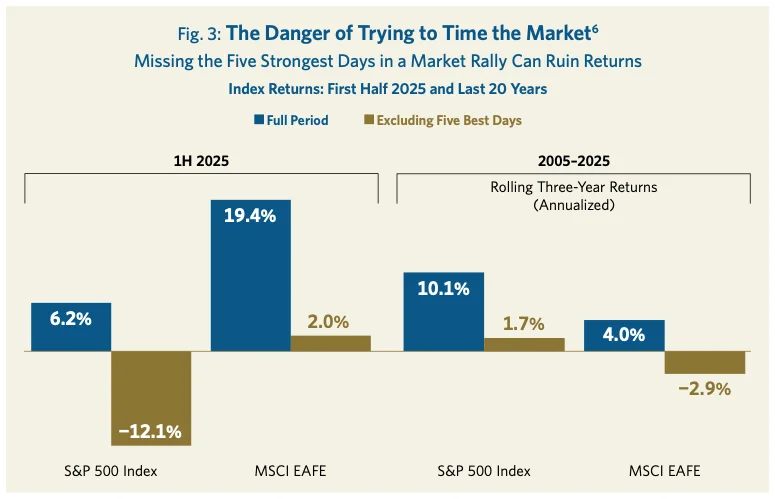
In addition to selecting companies with durable competitive advantages at attractive valuations, an important tenet of successful investing is to remain invested and stay the course. The cost of trying to time the market is large and real. Figure 3 shows the difference in results between staying invested and missing the five best market days over the first half of 2025 and for all three-year rolling periods from 2005 to 2025. For example, an investor in the S&P 500 Index who missed the five best days in the first half of 2025 would have underperformed a buy-and-hold investor by more than 18 percentage points. Trying to time the market can carry a high price.
State of the Economy
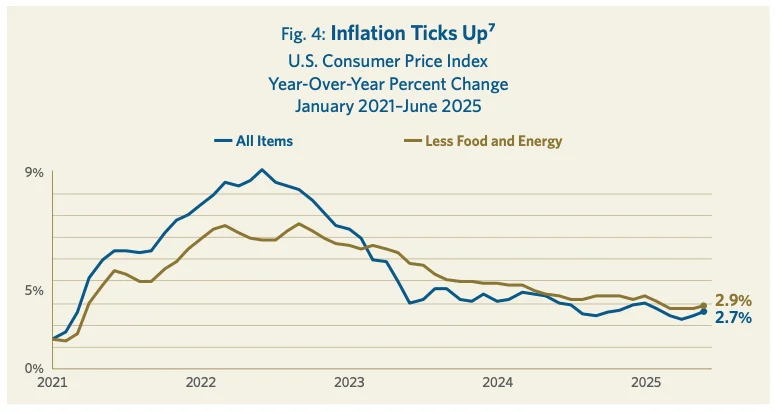
Despite inflationary expectations jumping up to 5.0% in April, the actual year-to-date inflation as measured by the consumer price index (CPI) has largely remained in check (see Figure 4). However, in June, the CPI ticked up to 2.7%, higher than the previous three months and raised the concern that inventories purchased before the tariffs were exhausted, and that we were starting to see the higher price of tariffed goods show up in the data.
In 1Q25 U.S. GDP growth was anemic, falling at an annual rate of -0.5%. This was mainly due to a surge of imports ahead of the tariffs being implemented and a downturn in government spending. (Imports are a subtraction in the calculation of GDP.)4
Second-quarter GDP is forecast to rebound to 2.8% growth.5 The high level of pre-buying of imports in the first quarter is expected to lead to a drop in imports in the second quarter, and consumer spending is anticipated to stay resilient.
The forecast for U.S. economic growth in the second half of the year, however, is weak. The tariffs implemented in the second quarter are expected to lead to higher consumer prices in the third quarter and especially in the fourth quarter. The Conference Board is projecting GDP growth of 1.4% in the third quarter and only 0.8% in the fourth quarter, with full-year 2025 GDP growth expected to be 1.6%.8 The uncertainty factor in all economic forecasts for 2025 is high as we have not seen tariffs at current levels since 1910.
Nonetheless, there is good reason to expect some impact on consumer spending given that the current average effective tariff rate of 15.8% (as of July 17, 2025) is forecast to result in a $2,000 decline in average U.S. household spending power, according to The Budget Lab at Yale.9 Even if the U.S. administration does not implement the higher tariffs that it has proposed if no trade deals are reached, the current average tariff level will likely lead to lower economic growth and corporate profitability.
The fall in global GDP expectations as well as reduced trade with the world’s largest economy (the U.S.) has impacted most emerging markets, including China, India, Brazil, Mexico and Southeast Asia. Developed economies such as Canada and France also expect to see lower growth rates in 2025 compared to 2024. The current forecast for global GDP growth in 2025 is 2.9%, down from 3.1% in January.
Euro area growth expectations are for 2025 GDP growth similar to last year, at 0.9%, based on reduced trade with the U.S. offset by an increase in deficit spending in some countries such as Germany.10 As a result of these lower long-term growth expectations, DWLD’s European holdings are generally corporations with a global focus that have customers and investments in a number of geographies. One example is the investment company Prosus, headquartered in Amsterdam but with large investments in China, India and the U.S. Others include the Swiss financial Julius Baer, a global wealth manager, and the German food delivery firm Delivery Hero, which has a major presence in South Korea and the Middle East. We also own Danske Bank, which is the largest bank in Denmark, a country that is an outlier in Europe with an expected robust GDP growth rate of 2.9% in 2025.11
China:
Too Important to Ignore
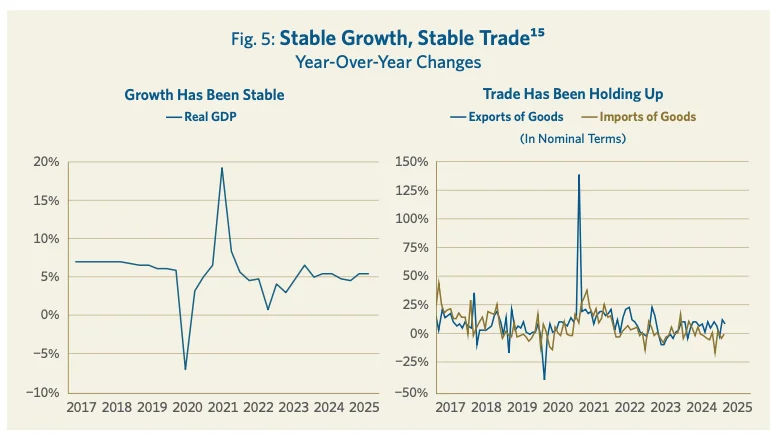
Long-term investors need to pay attention to China due to the size of its economy, its strong rate of growth and its high level of innovation. With a 2025 GDP forecast at over $19 trillion and having grown 5.3% in the first half of the year, the world’s second largest economy is too big and growing too fast to ignore. Some 52% of first-half growth in China came from consumer spending and 31% from exports as consumption is increasingly becoming the key driver of growth.12 Expectations are for a trade-related slowdown in the second half, but with full-year 2025 GDP expected to grow at a still respectable 4.7% rate (see Figure 5).13
Sometimes investors question the reliability of Chinese GDP data, and the U.S. Federal Reserve took up this question in a study published on June 6, 2025. The paper, titled “Is China Really Growing at 5 Percent?,” has a lot of good data and is worth reading.14 The authors compare official Chinese GDP figures with a “large set of indicators that are informative about the Chinese business cycle, including industrial production, retail sales, property market data, and reported exports to China from other countries, among others.”
The key conclusion is that “our findings suggest that recent GDP growth figures, which have been in line with the stated target, appear to align closely with broader Chinese economic indicators and do not appear to be overstated. We find that the recent near-target growth has been driven by a strong supply-side performance, supported by sustained global demand for Chinese goods and industrial policies promoting self-reliance. This has helped offset weak domestic consumption, which never fully recovered from COVID-era lockdowns and continues to be constrained by the ongoing property slump.”
We will remain vigilant, however, about the data we rely on to make investment decisions which includes comparing government published economic figures to key industrial and third-party data.
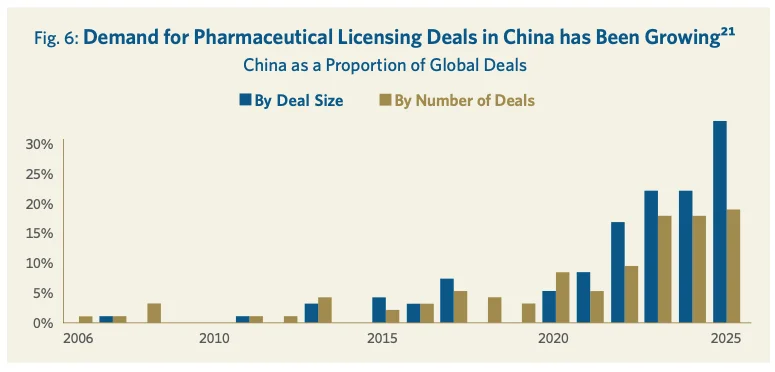
In our nearly two decades of investing in China, we have seen its level of innovation surge, positioning it at the forefront of several cutting-edge industries. China accounts for over 70% of global electric vehicle (EV) production,16 80% of global battery cell production17 and over 80% of global solar panel production.18 China is also growing in high-tech sectors where traditionally it did not have a major presence. In the first half of 2025, China’s share of global biotech and pharmaceutical licensing deals was 18% by number of deals and over 30% by deal size (see Figure 6). These figures are up from about 5% prior to 2020 so the ability to create novel therapies is a recent development.19
Robotics is another industry where China recently lagged but is now close to leading. The main driver has been the growth of the industrial robot sector—this is despite headline-grabbing stories like the recent deployment of 41 robots in Shenzhen that ride the subway to restock the over 100 7-Eleven convenience stores located in the subway system.20
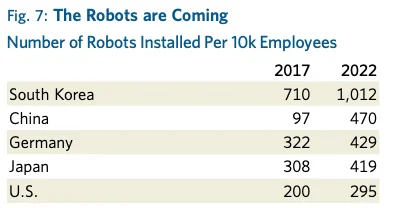
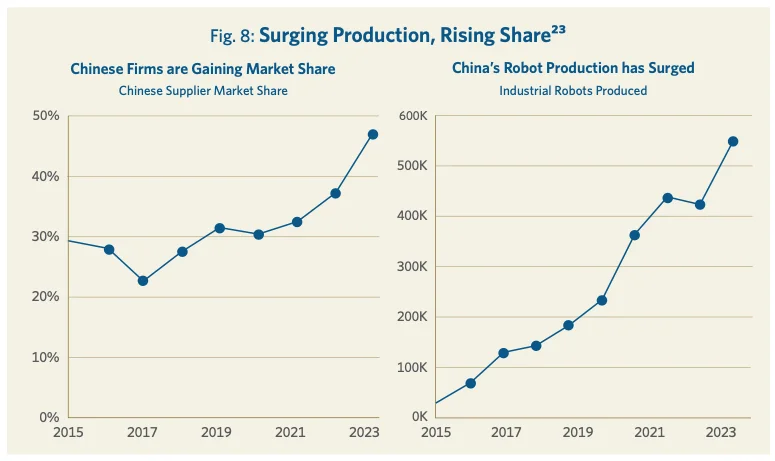
A decade ago, annual production of industrial robots in China was 33,000. By 2024 it had reached 560,000, an increase of nearly 17 times. The automation of China’s large domestic manufacturing base was key in driving the growth of Chinese industrial robots. In five short years China went from a laggard in automation to a leader, ahead of Germany, Japan and the U.S. (see Figure 7).
The quality of China’s industrial robots has also improved, and domestically produced robots are now taking a growing share of the home market, which used to be dominated by foreign brands (see Figure 8).
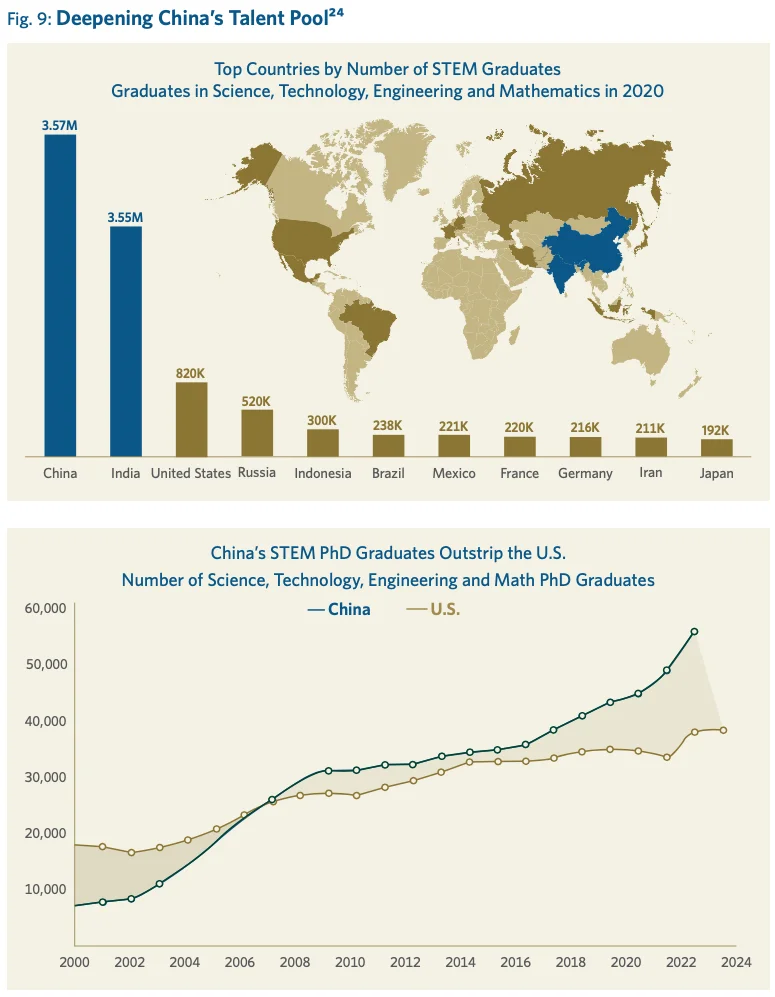
One of the main reasons for China’s success in innovation-driven industries is its huge and growing science, technology, engineering and mathematics (STEM) talent pool. China leads the world in the number of STEM graduates produced annually (see Figure 9). This lead in STEM talent compounds over time as STEM graduates launch the next generation of innovation-driven companies and create more opportunities for future STEM graduates. The quality of STEM graduates in China has also increased—now China produces the most STEM PhDs in the world, and its lead has been growing.22
While size, pace of growth and a high rate of innovation are strong motivations to study Chinese investments, the reason to own them today are their attractive valuations (see Figure 10).
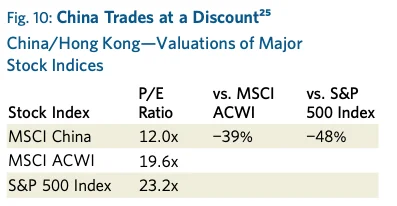
The MSCI China Index was trading at a very significant 39% discount to MSCI ACWI as of July 18, 2025, and an even greater 48% discount to the S&P 500 Index, making several of these high-quality innovative companies attractive long-term investments. Investing in China contains risks including geopolitics, trade relations and a possible economic downturn. However, we feel that the attractive valuations for China’s worldclass companies are currently compelling for long-term investors.
Portfolio Holdings
Solventum
Solventum is a U.S. healthcare business spun out of 3M in April 2024. The company generated over $8 billion in revenue in 2024, most of which came from selling medical-surgical products (mostly for infection prevention and wound care) to hospitals and clinics. Solventum also sells products to dentist offices (e.g., consumables for preventive dental care) as well as coding and transcribing software to hospitals.
The business has a long history of attractive growth and margins, but performance weakened under 3M ownership in recent years due to a lack of new product investment and poor integration of acquired businesses, among other factors. The management team, led by industry veteran Bryan Hanson, has deep healthcare experience and a successful collaboration under their belts at a prior healthcare spinoff (Covidien). They are highly focused on reinvigorating earnings growth (back to approximately 4–5% annually) and growing margins. They have also approached the portfolio with fresh eyes, which led to an agreement to sell a non-core purification and filtration business to Thermo Fisher Scientific for an attractive price. Key risks include leverage (which will improve once the company receives proceeds from the sale), as well as the operational risks from standing up independent systems and disentangling from former parent 3M.
We bought most of our shares in the heavy selling that accompanied the spinoff post-separation at an attractive valuation of 10x owner earnings.
NetEase
Founded in 1997, NetEase is the second largest online video game developer and publisher in China. Like many Chinese internet companies, NetEase is a founder-led company with William Ding (only 53 years old) at its helm. The company owns and operates a large portfolio of mobile and PC games popular among Chinese gamers. NetEase’s roots are in the massively multiplayer online role-playing game (MMORPG) genre. It has several flagship titles like Westward Journey and Fantasy Westward Journey that date back to the early 2000s yet remain meaningful revenue generators even today. NetEase was originally a PC-based game developer but has successfully transitioned its titles to mobile and, over time, has expanded its game portfolio via in-house development and through partnerships with Western IP holders like Marvel and Blizzard. The online video game business is the key value driver, making up 79% of revenues and an even higher percentage of profits. However, the company has also organically stood up a handful of other businesses over the years with its ventures in online education (Youdao) and streaming music (Cloud Music) being the most notable.
NetEase’s games are primarily free-to-play with monetization coming from the sale of in-game virtual items such as special avatars, privileges and weapons. Mobile games generated 73% of NetEase’s gaming revenues in 2024 with the remainder coming from PC games. Owning and operating category-leading free-to-play online games has proven to be a great business over time, particularly as key franchises continue to prove their durability and stickiness with users. New hit games are increasingly difficult and risky to develop given the rising cost per game and falling success rate. NetEase has a highly profitable portfolio of franchise games and a strong track record of producing hit games. This makes it one of the few game developers well-positioned to earn good returns on future game development and capitalize on the long-term growth potential of the market.
In late 2024, when the market was concerned about near-term revenue weakness in several game franchises, we took advantage of weakness to build a position in NetEase at an attractive valuation. Even after its strong year-to-date performance in 2025, NetEase remains reasonably priced at just 14x expected 2026 owner earnings, given its improved growth outlook and best-in-class management team with a long track record of shareholder returns. Key risks include the potential for further regulations that put restrictions on new game licenses, playing time or monetization, a prolonged period in which the company fails to develop new hit games, and increased competition from rival Tencent.
ITOCHU
Founded in 1858 by Ito Chubei, ITOCHU is a leading Japanese sogo sosha (trading and investment company). ITOCHU is like Berkshire Hathaway (which is one of its largest shareholders) without the insurance businesses. It even shares a similar beginning in the textiles business. The trading business focuses on a wide array of products from raw materials to finished products across industries like textiles, chemicals, energy and food. ITOCHU’s investment business takes strategic positions in companies and assets across the value chain. Its approach is hands on and long term, with a focus on integrating investments across the ITOCHU platforms. Currently, ITOCHU has more than 200 consolidated businesses.
ITOCHU is attractive due to its disciplined investment process and capital allocation. It makes no large directional bets and focuses on steady returns in boring businesses. ITOCHU attracts top talent in Japan and offers employees an opportunity to work in a variety of industries and geographies. The company has built its deep expertise trading for and owning businesses in all aspects of the local economy for decades and counts on this deep operating knowledge to make capital allocation decisions.
ITOCHU trades at under 12x P/E and 1.9x trailing price-to-book. We believe ITOCHU can generate a mid-teens return on equity over the medium term which should enable it to grow earnings by high single digits while paying a 2–3% cash yield and doing modest share buybacks.
The key risks with ITOCHU would be a change in investment culture and substantial capital allocation to businesses outside of its core competence.
Outlook:
Durability and Resilience
In a year of extreme volatility and uncertainty, we are pleased that our focus on owning companies with durable competitive advantages run by experienced managers trading at attractive valuations has enabled us to outperform the market indices. The significant valuation discount that our portfolio trades at compared to our benchmark indicates that we did not sacrifice our valuation discipline to achieve strong results. Rather the combination of strong earnings growth and a low valuation led to strong investment gains.
We remain watchful for risks which include the high valuation of certain stocks, inflationary pressures, trade relations, large government deficits and debt levels, geopolitical volatility and recession threats. However, our portfolio has been built with a focus on durability and resilience. We expect our portfolio companies’ strong balance sheets, cash generation power and adaptability to produce good results through shifting economic conditions.
For more than 50 years we have navigated a constantly changing investment landscape guided by one North Star: to grow the value of the funds entrusted to us. We are pleased to have achieved strong results thus far and look forward to the decades ahead. With more than $2 billion of our own money invested in our portfolios, we stand shoulder to shoulder with our clients on this long journey.26 We are grateful for your trust and are well-positioned for the future.
DWLD Davis Select Worldwide ETF
Semi-Annual Review 2025
Managers