Executive Summary
- Over the year ended June 30, 2024, DUSA returned 30.61% compared to 24.56% for the S&P 500 Index.
- After more than a decade of record low interest rates, the U.S. Federal Reserve began increasing interest rates in March of 2022, marking the end of the free-money era which began with the global financial crisis (GFC) of 2008–2009. While this period of normalization will likely include unexpected volatility and disruptions, the portfolio is well-positioned for the return to normal, having outperformed the S&P 500 Index since March 2022.
- Our portfolio includes companies with resilient growth, those with durable earnings power and significant free cash flow, and those with some combination of long-lived assets, pricing power, competitive advantage, balance sheet strength, proven management and attractive valuation.
The average annual total returns for Davis Select U.S. Equity ETF for periods ending June 30, 2024, are: NAV Return, 1 year, 30.61%; 5 years, 13.13%; Inception (1/11/17), 11.39%; Market Price Return, 1 year, 31.05%; 5 years, 13.26%; Inception, 11.44%. The performance presented represents past performance and is not a guarantee of future results. Investment return and principal value will vary so that, when redeemed, an investor’s shares may be worth more or less than their original cost. For the Fund’s most recent month end performance, visit davisetfs.com or call 800-279-0279. Current performance may be lower or higher than the performance quoted. NAV prices are used to calculate market price performance prior to the date when the Fund was first publicly traded. Market performance is determined using the closing price at 4:00 pm Eastern time, when the NAV is typically calculated. Market performance does not represent the returns you would receive if you traded shares at other times. The total annual operating expense ratio as of the most recent prospectus was 0.61%. The total annual operating expense ratio may vary in future years.
This material includes candid statements and observations regarding investment strategies, individual securities, and economic and market conditions; however, there is no guarantee that these statements, opinions or forecasts will prove to be correct. All fund performance discussed within this material are at NAV and are as of 6/30/24, unless otherwise noted. This is not a recommendation to buy, sell or hold any specific security. Past performance is not a guarantee of future results. The Attractive Growth and Undervalued reference in this material relates to underlying characteristics of the portfolio holdings. There is no guarantee that the Fund performance will be positive as equity markets are volatile and an investor may lose money.
Performance:
Growing Shareholder Wealth
DUSA one-year results exceeded the 24.56% return on the S&P 500 Index, adding to the portfolio’s long-term record since its inception.
Market Perspective:
End of the Free-Money Era
The portfolio’s recent outperformance coincides with the overdue bursting of the easy-money bubble after more than a decade of distortions caused by near zero percent interest rates. This shift to a more normal environment began on March 16, 2022 when the Federal Reserve announced the first of 11 consecutive increases in the Federal funds benchmark rate, the steepest rate of change ever. Before discussing how our portfolio is well-positioned to take advantage of this return to normalcy, it is important to understand just how extreme the previous decade of interest rate distortion had become. During this so-called free-money era, both short- and long-term interest rates approached their lowest levels in recorded history (see Figure 1).
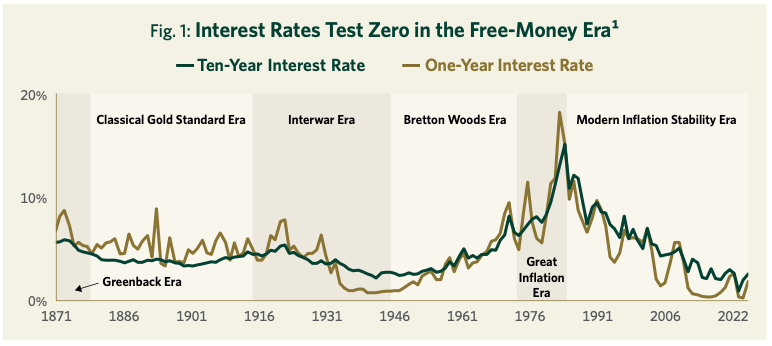
Interest rate suppression (both directly and indirectly through a bond purchase policy known as quantitative easing) became a matter of national policy, first in response to the great financial crisis (GFC) of 2008–2009, and then the COVID-19 crisis in 2020–2021. It was accompanied by dramatic increases in government spending and ballooning federal deficits.
As the cost of money approached zero despite huge increases in money supply, these policies created significant market distortions. Assets were mispriced, risks ignored, inflation allowed to metastasize, and valuation discipline penalized. Given the sheer magnitude of these distortions, the great unwinding that began in 2022 still has a long way to go. Investors should be prepared for unexpected disruptions and heightened volatility. The high valuations of many of today’s market darlings rest on extremely rosy assumptions. Although the trigger may be unknowable, these assumptions can change quickly should the market’s current optimism be undercut by the unpleasant appearance of one or more so-called black swans, inevitable but unpredictable shocks to the system.
As for the short term, while we do not expect further interest rate increases this year, and in fact believe that interest rates may come down for a time as the inflation outlook normalizes, the free-money bubble that began in 2009 has burst and the reckoning will continue
Portfolio Positioning:
Selective, Growing and Undervalued
For investors like us who have always adhered to a valuation discipline, the unwinding of the free-money bubble is an overdue but unsettling return to normalcy after more than a decade of delusion. As we return to reality and prepare for more volatile times, we are encouraged that the companies we own (including our carefully selected banks) are well-positioned for this changing environment, and that DUSA has outperformed the indices since the free-money era ended.
While short-term results signify little, it should come as no surprise that investors are once again seeking durability, profitability, cash production, valuation and balance sheet strength. It is these characteristics that allow companies to better navigate a period of higher inflation and economic uncertainty. Returning to more normal interest rates may create headwinds for many of the market darlings that led for so long, and tailwinds for the type of durable, attractively valued businesses that lie at the heart of our investment discipline.
Importantly, while recent returns have been strong, our DUSA portfolio remains significantly undervalued compared to the market averages. Our carefully selected group of companies trade at less than 15 times forward earnings (see Figure 2). This is a 37% discount to the S&P 500 despite these companies having grown their earnings per share almost 17% per year over the last five years. This rare combination of durable growth and discount prices is a value investor’s dream that positions us well for the years ahead.
Fig. 2: Selective, Attractive Growth, Undervalued2
| DUSA | Index | |
| Holdings | 25 | 503 |
| EPS Growth (5 Year) | 16.5% | 17.2% |
| P/E (Forward) | 14.5x | 22.9x |
Our long-term conviction includes the recognition that short-term corrections and surprises are an unpleasant but inevitable part of the investment landscape. History shows investors should expect a 10% correction on average once per year and a 20% correction every 3.5 years (see Figure 3). Given the excesses of the last decade, we see no reason to imagine that the future will be immune from shocks, crises, volatility and corrections. Our job is not to try to predict the unpredictable but rather to prepare for the inevitable.

Four Overarching Ideas
While we build our portfolios from the bottom up based on company-by-company research rather than top-down trends, most of the attractively valued and durable businesses we own reflect four overarching, long-term themes (See Figure 4).
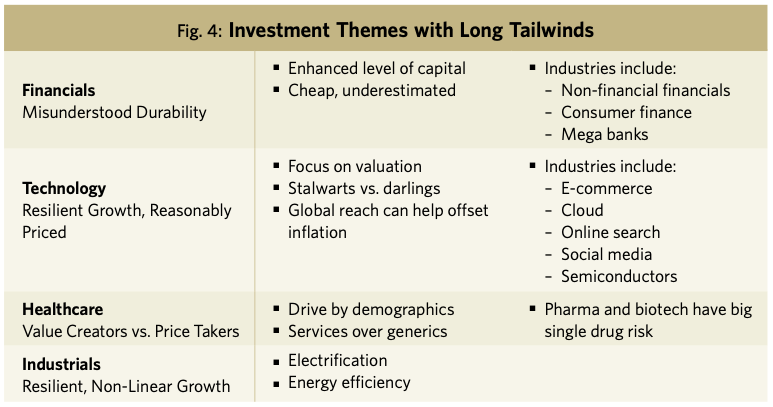
Financials: Misunderstood Durability
Financial companies represent the largest sector weighting in DUSA and reflect a theme we describe as “Misunderstood Durability.” Since the GFC, investor sentiment has tended to view financial companies in general, and banks in particular, as fragile, volatile and prone to disaster. That two large banks, Silicon Valley Bank and First Republic (neither of which we had ever owned), collapsed less than two years ago due to company-specific mismanagement of interest rate risk reinforced a perception of fragility for all banks.
This perception is understandable but inaccurate with regards to the select banks we own, such as Wells Fargo, JP Morgan, Capital One and U.S. Bancorp. These actually grew their customer bases through both the GFC and the regional banking crisis of 2023. What’s more, throughout the last decade, the combination of higher capital ratios, higher market shares and tighter regulation have reduced the riskiness of these well-run institutions while increasing their durability and competitive advantages. While their quarterly and even annual earnings can be volatile, such “lumpiness” does not diminish the fact that these companies generate capital through the business cycle at an attractive rate and use the capital they generate to increase shareholder value by steadily increasing dividends and buying in shares at discounted prices.
Technology: Resilient Growth, Reasonably Priced
Technology, broadly defined, makes up the portfolio’s next largest theme. As with financials, the term technology covers a wide range of companies with diverse types of business models. Within the tech universe, we focus on a select few companies that combine proven long-term growth with reasonable valuations. This valuation discipline has led us to avoid many of the market darlings that have driven the S&P 500 in recent years, including several of the so-called Magnificent Seven tech darlings that today represent an unprecedented concentration of 32% of the S&P 500.
In fact, while others have been piling into companies like Meta and Alphabet, which we have owned for many years, we have used their recent outperformance as an opportunity to evaluate and reduce our positions as needed in these excellent, but richly valued, companies. Instead of market darlings such as Nvidia, Apple or Tesla, our technology investments have been focused in durable, proven but less glamorous parts of the technology sector such as semiconductor manufacturing (Intel and Texas Instruments) and capital equipment (Applied Materials).
No discussion of the tech sector (or indeed of the market as a whole) would be complete without some reference to the advent of generative artificial intelligence, or so-called GenAI. While we are naturally skeptical of hype, we must begin by stating unequivocally that GenAI is likely to be one of the most transformational technological developments in modern history and one that is almost certain to drive major advances across numerous industries. However, as long-term market observers, we are also equally certain that this revolutionary technology will lead to hyperbole, irrational exuberance4 and unfulfilled promises. The stock market in particular is susceptible to wishful thinking and the fear of missing out (FOMO). FOMO leads investors to pile into companies making the most headline-grabbing claims about the future while turning their backs on those with proven businesses with demonstrated competitive advantages.
"While AI stocks will likely go through booms and busts, the underlying technology is transformational and will be a permanent part of the economic landscape going forward."
In particular, we believe many companies are being rewarded for being early beneficiaries of AI demand with the expectation that their revenues and earnings will continue to grow rapidly in the future. The market for AI products and services, however, is still in its very early days and competition is fierce. We believe it is very risky to project who the long-term winners and losers will be based on their past one or two years of performance. For example, the substantial technological and societal transformations heralded by the internet in the 1990s culminated in the dot-com bubble. Then, as our friend Bill Nygren, portfolio manager at Oakmark Funds, recently reminded investors, “in 2000, amidst dot-com hysteria, the largest cap market darlings were Cisco, America Online (AOL) and Yahoo!. AOL and Yahoo! ended up nearly worthless, and Cisco, currently at a lower share price than in 2000, has lost 80% relative to the S&P 500. We think these results should give pause to anyone believing the AI winners have already been determined.” We couldn’t agree more.
As with the internet, our approach is to avoid the “story stocks” and instead ask which companies can use this powerful new tool most effectively to build the value of their businesses and, just as importantly, which companies are most threatened by this new technology. While AI stocks will likely go through booms and busts, the underlying technology is transformational and will be a permanent part of the economic landscape going forward. As such, questions about its impact are already a standard part of our research process. By incorporating this mindset into our company analyses, we are reminded of Amara’s Law which states that “We tend to overestimate the effect of a technology in the short run and underestimate the effect in the long run.”5 The advent of GenAI will only reinforce this important adage.
Healthcare: Value Creators versus Price Takers
For decades, healthcare spending relentlessly rose from 5% of U.S. GDP in 1960 to roughly 17% in 2010. However, reflecting the wisdom of Herb Stein’s famous observation that “if something cannot go on forever, it will stop,”6 the rollout of the Affordable Care Act in 2010, along with a range of other public and private initiatives, led to a flattening of this growth. Today, while healthcare spending remains a political hot button, it is somewhat encouraging that 14 years later the industry’s share of GDP still stands at 17% despite the invention of many expensive new therapies in the interim.
To offset the rising costs of novel treatments and innovative (and patented) pharmaceutical therapies, the healthcare system has needed to constantly find savings elsewhere. As a result, our investments in this important sector have focused on those companies that play a part in moderating or reducing the natural rate of increase in healthcare spending. Companies such as Cigna and Humana, for example, offer programs like Medicare Advantage which delivers patients a higher quality of care at a lower cost. Given the inefficiencies and incentives of government agencies versus the private sector, we are not surprised that such companies have long records of success. Similarly, lab testing companies like Quest Diagnostics and branded generics companies like Viatris continue to reduce costs in the healthcare system. On the other side of the ledger, while we marvel at the enormous profits created by novel pharmaceutical and biotech breakthroughs, we find it difficult and risky to try to predict the next winners while also quantifying the duration of those profits given the development of me-too competitors and evolving drug reimbursement policies.
Industrials: Resilient, Non-Linear Growth
In an age of digitization, software, AI, content creation, online advertising and hot consumer brands, companies that operate railroads and generate electricity (Berkshire Hathaway), extract copper (Teck Resources), manufacture insulation (Owens Corning), raise food (Tyson) or produce oil (Tourmaline) may sound dull, but our civilization cannot function without their products. The necessity of these products and, in many cases, the environmental risks of producing them, creates regulatory and legal complexity. What’s more, their production often requires large upfront capital investment, and the demand and supply of them in any short-term period may well be subject to cyclical swings, resulting in earnings volatility. Further, as such products are not especially differentiated, price and availability are often the only drivers of customer preference, making it difficult for any one company to maintain high returns without attracting new competition.
So how do we find attractive opportunities in such a difficult category? First, because many such dull businesses are overlooked and out of favor in today’s growth-driven market, carefully selected industrials currently sell at extremely low valuations despite having long-term records of growth, durable earnings power, competitive advantages driven by low cost assets or economies of scale, and some inflation protection due to long-lived assets.
What’s more, certain long-term trends may be accelerating the growth rates of a number of these companies. For example, in a world of massively expanding computing power, the need for electricity is markedly accelerating. Also, trends like electrification of automobiles and expansion of the electricity grid increase copper demand at a rate that is likely to continue to outstrip growth in supply (a byproduct of the enormous regulatory challenges of permitting and building new mines). Finally, in ways that are hard to anticipate, the advent of AI is almost certain to create enormous disruption in the relatively more popular and historically faster growing service sector of the economy. The low valuations of dull industrial businesses that are resistant to obsolescence compared to valuations in a service sector facing significant uncertainty may well lead people to view our industrial holdings with more enthusiasm. As one thoughtful analyst recently analogized in looking at the disruption risk facing many service companies, “At the launch of the iPhone, flashlight manufacturers were not worried.” Similarly, we recently noticed a billboard outside a large commercial construction site that said, “Hey ChatGPT, finish this building…… Oh wait…”, a cheeky reminder that it will be some years before GenAI can do construction, not to mention mine copper, extract oil, or raise, process and deliver food from the farm to our homes.
Pessimism Never Goes Out of Fashion
Recently our friend and author Shane Parrish shared a striking quote that seems to capture the current mood of our country:
“It is a gloomy moment in the history of our country. Not in the lifetime of most men has there been so much grave and deep apprehension; never has the future seemed so incalculable as at this time. The domestic economic situation is in chaos…Prices are so high as to be utterly impossible. The political cauldron seethes and bubbles with uncertainly. Russia hangs, as usual, like a cloud, dark and silent, upon the horizon. It is a solemn moment. Of our troubles, no man can see the end.”
What makes this description so striking is that it was written in Harper’s Weekly in 1857.
Pessimism, fear and uncertainty are nothing new. And yet we live far better lives today than ever before. For long-term investors, it has always been a mistake to bet against humanity in general and the United States in particular. While it is true that we currently face significant challenges, it is equally true that we are living through a period of enormous global progress. Technology and innovation have contributed enormously to human progress, and with breakthroughs like GenAI, genomics and alternative energy (including compact nuclear reactors) still in their infancy, we see no reason to believe that the record of the last 2,000 years should not continue. At a time when many feel the world has been getting worse, the data tells a different story (see Figures 5 and 6).
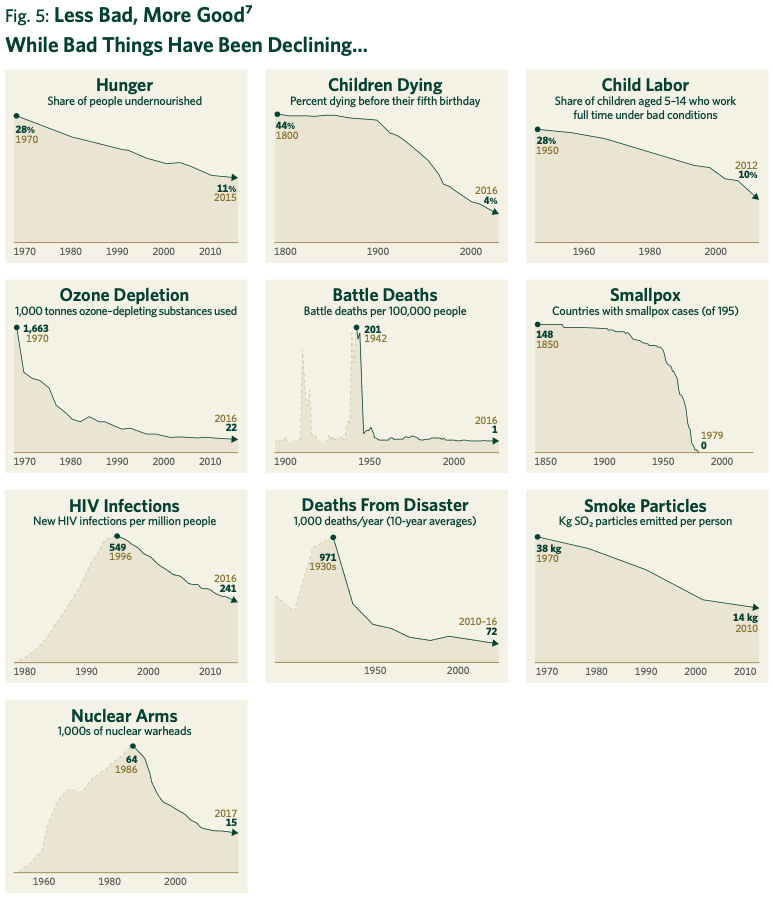
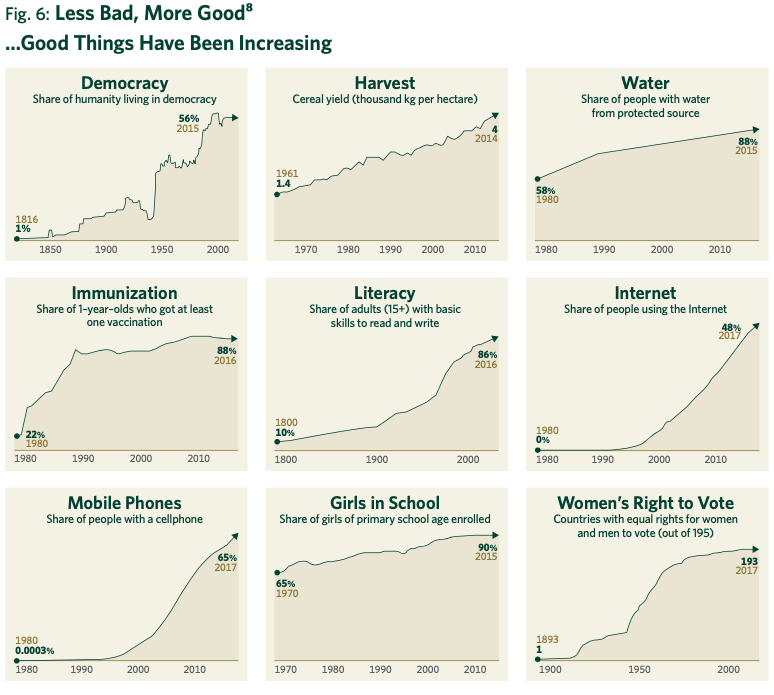
Our confidence that our country and our species has not come to the end of our forward progress does not make us blind to the risks we face. In fact, our awareness of these risks is the very reason that we seek out companies with proven records of durability, resilience and profitability.
Outlook:
Navigating the Transition
From 2008–2022, artificially suppressed interest rates created a period of unprecedented economic and market distortion. Throughout that period, fundamental investment analysis—which rests on discounted present value, cost of capital and risk management—became largely irrelevant. Valuation discipline fell out of favor and the market increasingly rewarded momentum and speculation.
All that changed in the first quarter of 2022 when interest rates began a long overdue period of normalization. The effects of this return to normalcy will be volatile and will unfold over a long period of time. Companies and investors that are not well- prepared face big problems, only some of which have come to light. As this bubble bursts, we expect many more unpleasant surprises, particularly in the most levered and speculative areas of the market and economy.
For Davis Advisors, this transition marks a return to normalcy. The key pillars of success in this tumultuous environment are the cornerstones of our investment discipline: cash generation, conservative capital structure, durable business model, low valuation and proven management. We are pleased that our portfolio has outperformed during this transition, and is strongly positioned to build wealth in the decade to come as our carefully selected group of companies combine attractive valuations with long-term growth.
For more than fifty years, we have navigated a constantly changing investment landscape guided by one North Star: to grow the value of the funds entrusted to us. We are pleased to have achieved strong results thus far and look forward to the decades ahead. With more than $2 billion of our own money, we stand shoulder to shoulder with our clients on this long journey.9
We are grateful for your trust and are well-positioned for the future.


DUSA Davis Select U.S. Equity ETF
Semi-Annual Review 2024
Managers