
Key Takeaways
- DINT posted a strong return of 7.77% during the first six months of 2024, outperforming the 5.69% return of the MSCI ACWI (All Country World Index) ex US by 2.08%.
- DINT’s collection of world-class companies compares favorably to the MSCI ACWI ex US. The portfolio’s holdings have grown earnings 30% more than the companies in the index, yet are 41% less expensive.
- Artificial intelligence (AI) drove strong earnings for many of DINT’s companies—including Tokyo Electron and Naspers/Prosus—which helped contribute to the fund’s outperformance.
- Recently, the U.S. has seen its economy go from strength to strength, but we would be wise to prepare for more challenging times going forward. While we remain bullish on the U.S. economy in the long term, the huge fiscal and monetary stimulus since the Great Financial Crisis has created economic and market conditions that make international equities attractive on a relative basis.
- In China for example, despite the recent weaker levels of consumer spending, the drivers of long-term economic growth—like high levels of technological innovation and talent—are in place. Today low equity valuations and strong cash returns to shareholders create opportunities in select Chinese investments.
The average annual total returns for Davis Select International ETF for periods ending June 30, 2024, are: NAV Return, 1 year, 7.47%; 5 years, 3.80%; Inception (3/1/18), 1.35%; Market Price Return, 1 year, 7.39%; 5 years, 3.66%; Inception, 1.31%. The performance presented represents past performance and is not a guarantee of future results. Investment return and principal value will vary so that, when redeemed, an investor’s shares may be worth more or less than their original cost. For the Fund’s most recent month end performance, visit davisetfs.com or call 800-279-0279. Current performance may be lower or higher than the performance quoted. NAV prices are used to calculate market price performance prior to the date when the Fund was first publicly traded. Market performance is determined using the closing price at 4:00 pm Eastern time, when the NAV is typically calculated. Market performance does not represent the returns you would receive if you traded shares at other times. The total annual operating expense ratio as of the most recent prospectus was 0.66%. The total annual operating expense ratio may vary in future years.
This material includes candid statements and observations regarding investment strategies, individual securities, and economic and market conditions; however, there is no guarantee that these statements, opinions or forecasts will prove to be correct. All fund performance discussed within this material are at NAV and are as of 6/30/24, unless otherwise noted. This is not a recommendation to buy, sell or hold any specific security. Past performance is not a guarantee of future results. The Attractive Growth and Undervalued reference in this material relates to underlying characteristics of the portfolio holdings. There is no guarantee that the Fund performance will be positive as equity markets are volatile and an investor may lose money.
Current Positioning, Long-Term Performance and Recent Results
DINT posted a strong return of 7.77% for the first six months of 2024, outperforming the 5.69% return of the MSCI ACWI ex US by 2.08%. In this report, we discuss factors that contributed to the fund’s good performance, along with underperformers during the same period.
Contributors to 2024 Performance
For the first six months of 2024, consumer-facing internet holdings were major contributors to DINT’s outperformance. Meituan, up 36%, was the largest contributor as its China food delivery business rebounded strongly from COVID-related disruptions a year ago, and to date its in-store advertising business has successfully fended off competitive challenges from ByteDance’s Douyin. Meituan’s first international expansion has, within a year, captured 27% market share to become the number-two food-delivery player in Hong Kong.
Other internet contributors include the South African Naspers and its European-listed operating subsidiary Prosus—up 14% and 20%, respectively. Tencent, which is the main value driver at Naspers and Prosus has bolstered strong advertising revenue growth with the success of its WeChat Video Accounts business, which is a short-form live-streaming video service that competes with Douyin. In addition, Tencent’s latest large video game launch of Dungeon & Fighter Mobile (DnF) has been a big hit, becoming the top-grossing game app download in China. The South Korean e-commerce leader Coupang rose 29% as it continues to grow rapidly, reaching 30% share of the e-commerce market while successfully taking share from more established players in the food delivery segment.
Semiconductor equipment manufacturer Tokyo Electron, up 22% year to date, was also a major contributor to the fund. Tokyo Electron’s business is driven by long-term secular trends in AI, the Internet of Things (IoT), electric vehicles (EV) and clean energy, which in turn drives the demand for semiconductor chips and equipment. Tokyo Electron has also benefited from government subsidies to the semiconductor industry such as the CHIPS Act in the U.S. and a similar plan in Japan, which is driving funding for building semiconductor factories and the associated manufacturing equipment.
Banks: Development Bank of Singapore (DBS), Danske Bank and Bank of Butterfield had returns of 18%, 16% and 13%, respectively, during the first six months of the year. Continued economic growth, good net interest margins, low loan delinquencies and attractive dividend yields resulted in high total returns.
Industrials: Schneider Electric returned 22% and has benefited from growing electrification globally—especially at data centers, as AI uses four times as much power as systems that do not utilize AI. Running more power also increases cooling needs, which in turn demands more power.
Detractors to 2024 Performance
Detractors to DINT performance include Asian life insurance company AIA, which was down 21% and Chinese wealth manager Noah Holdings, which fell 30%. AIA’s fundamentals remain strong, with double-digit new business growth in almost all of their major geographies. The main concern remains whether the company can sustain its performance in China and Hong Kong, but we think those risks are overblown. AIA is still very small in China, with a low-to-mid single-digit market share of the life insurance market. The company targets only mass affluent and high net worth clients and services them using the industry’s most professional and best-trained salesforce. The Chinese insurance market has also been under pressure from declining government bond yields in China but AIA is less exposed due to the product mix they offer to their clients and their conservative balance sheet. AIA’s valuation remains very attractive with the stock trading just above embedded value, which means we are not paying much for the option of future growth. Management is high quality and buybacks plus cash dividends represent 6% of the company’s market capitalization—an attractive level of cash return to shareholders, especially given how quickly AIA is growing.
Noah Holdings’ revenues and earnings fell in the first six months as offshore clients switched from private equity to cash-management products to take advantage of higher yielding U.S. dollar-denominated securities. In the second half of 2024, however, investors will receive $140 million in dividends equivalent to 20% of its market capitalization. Because Noah currently has net cash (net of dividends to be paid in August) equal to 130% of market capitalization and is profitable—a rare net-net combination—we expect the company’s future cash dividend yield to exceed 10%, making Noah an attractive investment despite the weak operating results.
Current Perspective on Global Markets
The Need to Prepare For More Challenging Times
With unemployment at a very low 3.9%1 and a forecast of 2.5% gross domestic product (GDP) growth in 2024,2 the U.S. economy has been going from strength to strength. The S&P 500 Index’s 2023 performance—with a return of 26.3% followed by a 15.3% return in the first half of 2024—reflects this strong economic backdrop.
The strong economic and market performance has been all the more impressive as it has occurred despite a more than 5.00% rise in interest rates starting in March 2022. Over the past two plus years the biggest change in the economy and in the markets has been this rapid rise in interest rates—what we at Davis have dubbed “the return to normalcy.” Rate normalization has had profound implications for which businesses get funding, how they are funded and how companies are valued.
On a longer-term basis, the biggest change in the economy and investing environment has been the twin worries of the rising government deficit (spending more than we make) accompanied by the rising national debt (the result of years of high spending). The huge fiscal and monetary stimulus since the Great Financial Crisis has helped generate strong investor returns but we cannot assume that the economy will repeat this strong performance over the next several years. It is worrisome that the federal budget deficit was as high as 6.3% of GDP in 2023 in a year when GDP grew a robust 2.5%, unemployment was an incredibly low 3.7% and interest rates were close to zero percent. As Figure 13 shows, historically the federal budget deficit spikes in recession years as the government seeks to stimulate the economy and serves as a safety net for the unemployed but is low in years with a strong economy.
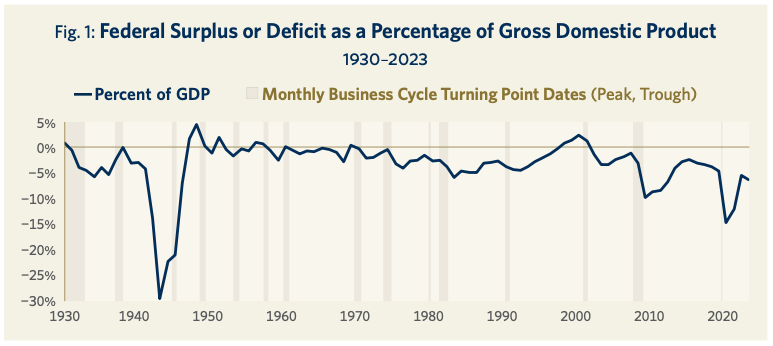
In 2007, the year before the Great Financial Crisis, the federal budget deficit was only 1.1% of GDP, which enabled the government to be extremely proactive in saving the economy. In the three decades between 1994 and 2023, the federal deficit averaged 3.8%. During this period, we also sustained multiple catastrophes: in 2001, the sharp recession following the dot.com bust; between 2007 and 2009, the Great Financial Crisis; and from roughly 2019 through 2023, the COVID-19 pandemic. Should a recession or other disaster occur today, we would worry that the government’s ability to address it effectively could be constrained by the size of the current budget deficit. Another constraint could be the size of the national debt, which has ballooned to 97% of GDP, a level we have not seen since World War II, except during COVID.4
Finally, while service of interest expense on the national debt was helped by the near-zero interest rates pre-2023, that is no longer the case. Interest expense as a percentage of federal spending was 5.2% in 2021, rising to 7.6% in 2022 when the Fed started raising rates in March, and then further growing to 10.7% in 2023.5 In 2023, net interest expense exceeded Medicaid spending, and in 2024 it is forecast to exceed national defense spending, too.6 Though it is true that the size of the federal deficit and national debt have been rising for some time, they would not necessarily cause an economic downturn in and of themselves. Rather, we are concerned that they could erode the degrees of freedom available to the government when we encounter the next national shock. Because of the risk that the U.S. government will be more constrained in its ability to support the economy in the future, it is more important than ever to ensure that our portfolio companies have the balance sheet and cash generation to survive a protracted economic downturn.
Given that both cash and fixed income could see a serious erosion of purchasing power, what is the best approach for investors to maintain their purchasing power in the future?
Real estate returns have also been materially affected by the higher rate and tighter credit environment and would be harmed should interest rates rise further. To us, the pricing power, resilience and adaptability of a well-run business is the wisest way to ensure that purchasing power is maintained. A durable competitive advantage leads to pricing power, while a strong balance sheet and cash generation create resiliency. Moreover, an experienced and talented management team could help the business adapt to changing circumstances.
How About Investing in a Market Index?
A dozen years of strong equity returns has made the market complacent about valuation. While the argument that a higher market P/E multiple was justified because interest rates were at historical lows might have been valid in the short-term, that logic can no longer be justified. Today at 5.5%, the federal funds rate is actually greater than the long-term average.7 By being selective and disciplined about valuation, DINT has built a collection of world-class companies with higher earnings growth rates and trade at a significant discount to the market index. In our experience, if you start with a significantly higher earnings yield and grow at a competitive rate over time, your portfolio returns will be attractive on both an absolute and a relative basis. The 41% P/E discount with 30% higher EPS growth levels as seen in Figure 2, bodes well for DINT’s future returns relative to the MSCI ACWI ex US.
Fig. 2: Selective, Attractive Growth, Undervalued8
| DINT | Index | |
| Holdings | 28 | 2,158 |
| EPS Growth (5 Year) | 16.5% | 12.7% |
| P/E (Forward) | 8.4x | 14.2x |
China: Challenges and Opportunities
The state of the Chinese economy has been a big focus for global investors over the last three-to-four decades and even more so since the start of the COVID pandemic in early 2020. In the years leading into the pandemic, from 2013–2019, China’s GDP growth averaged an impressive 6.95% per year. In the years since the pandemic, from 2020–2023, GDP growth has averaged a lower but still very acceptable 4.72%. GDP growth was 5.2% last year; the Chinese government’s official forecast is for “about 5% growth” in 2024 and economists are forecasting 4.5% growth in 2025. We do think a return to the 7% pre-pandemic growth rate is improbable because real estate, which accounts for 22% of GDP9 and infrastructure will grow at a slower pace. The easy credit environment for real estate developers is finished, and the view that there is strong demand for all large real estate projects in lower-tier cities no longer exists either. Nevertheless, our expectations are in line with most forecasters that the Chinese economy can grow 4–5% annually for the next several years, which is a good macro environment for our Chinese holdings.
A big driver of economic growth is the progress China has made in developing innovative science and research and development (R&D) projects. One way to measure scientific progress is the number of high-impact research papers published every year. These are papers that are cited the most by other scientists worldwide in their own research. In 2003, the U.S. produced 20 times as many high-impact papers as China, according to data from Clarivate, a science analytics company based in Philadelphia. By 2013, the U.S. produced about four times as many top papers and in the most recent data examining the number of papers released in 2022, China had surpassed the U.S. as well as the EU in number of papers published. Similarly, the British scientific journal Nature measured that in 2014 China contributed less than a third of America’s research papers to prestigious scientific journals. By 2023, China had ascended to the top spot. The Leiden Ranking, managed by the Dutch Leiden University, calculated that 6 of the top 10 universities ranked by scientific output were Chinese and that Tsinghua University was now the number-one science and technology university. So, in addition to volume metrics such as leading the world in number of STEM graduates or issuing the most patents for many years the quality of China’s science research has made a dramatic leap over the past decade.10
This rapid climb in the level of innovation has crucial implications for the ability of Chinese firms to be among the best in the industries of the future. In 2022, China accounted for 64% of global EV production and 70% of world’s lithium-ion batteries.11 By the end of 2023, BYD passed Tesla to be the world’s biggest manufacturer of purely battery-powered vehicles.12 China also accounts for 80% of solar panels manufactured globally13 as a result of having driven down manufacturing costs to 16–18.9 cents per watts of generating capacity compared to 24.3–30 cents per watts in the EU and 28 cents in the U.S.14 Even in areas that are at the leading edge of innovation such as quantum computing, China is making significant breakthroughs toward closing the gap with the global leader, the U.S.15 Another area where China has been making progress is in AI, where it contributes 40% of the world’s research papers compared with 10% for the U.S. and 15% for the EU and Britain combined. According to Zachary Arnold, an analyst at the Georgetown Centre for Emerging Security and Technology “China’s AI research is world-class. In areas like computer vision and robotics, they have a significant lead.”16
Investor returns have also benefited from Chinese regulators pushing listed companies to use their cash-rich balance sheets to improve shareholder returns. This effort led by top securities regulator Wu Qing mimics similar regulator-led efforts in Japan and South Korea.17 Over the past three years, listed Chinese firms have been returning $280 billion a year in dividends and share repurchases.18
Figure 3 displays the cash returns to shareholders for the latest twelve months of several of DINT’s largest Chinese holdings calculated as a percentage of market capitalization.
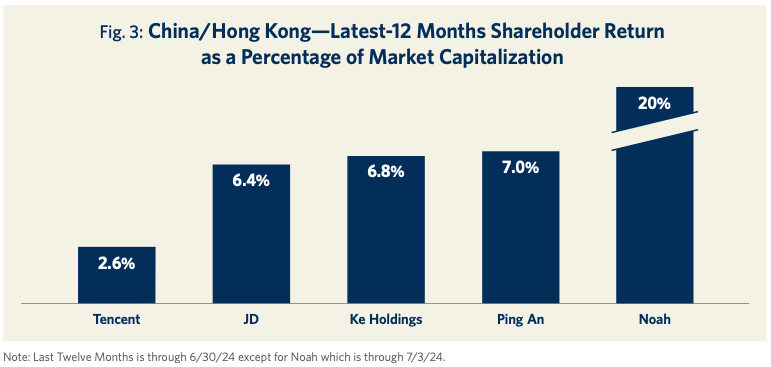
These high levels of cash returns to shareholders highlight the following key points: 1) Many of our Chinese holdings have very strong balance sheets with large amounts of net cash. 2) These companies generate a lot of free cash flow, which enables very consistent levels of dividend payments. 3) Managements are taking advantage of the low share prices by buying back their stock. 4) These companies’ valuations are very low (see Figure 4).
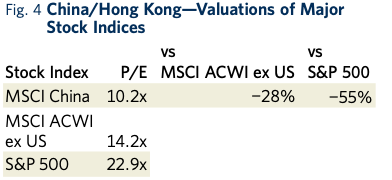
Figure 4 shows the forward P/E multiples of the major stock indices. The 28–55% discount that Chinese companies are trading at relative to the global and U.S. stock indices bodes well for future returns. Our Chinese holdings are a collection of competitively advantaged businesses with good growth prospects run by talented and experienced management teams and trading at very attractive valuations.
How Have We Positioned the Portfolio for AI?
As we noted in our last letter, many view generative AI as a transformational technology that, according to Nvidia, is poised to be “bigger than the PC, bigger than mobile and bigger than the internet, by far.” While we would agree that generative AI is going to lead to major technological advances and transform numerous industries, we also expect it will lead to hyperbole, irrational exuberance19 and unfulfilled promises. The stock market in particular is susceptible to wishful thinking and the fear of missing out (FOMO). FOMO leads investors to pile into companies making the most headline-grabbing claims about the future while turning their backs on those with proven businesses with demonstrated competitive advantages. In particular, we believe many companies are rewarded for being early beneficiaries of AI demand with the expectation that their revenues and earnings will continue to grow rapidly in the future. The market for AI products and services, however, is still in its very early days and competition is fierce. We believe it is very risky to project who the long-term winners and losers will be based on their past one or two years of performance. This can be a target rich environment for value-conscious stock pickers with a long-term focus.
So how has DINT positioned itself to take advantage of the growth opportunities created by the AI boom while avoiding overvalued narrative-driven stocks?
We seek out attractive businesses that are both proven and profitable but which also stand to benefit from the growth in AI. Tencent, for instance, has a highly profitable growing business as the leader in China in social media, messaging and video gaming. The company is well-positioned to leverage its technical AI talent and vast amounts of proprietary data to supercharge all three aspects of its business.
Within its social media platforms, we expect Tencent to see meaningful gains from AI driven ranking and recommendation improvements in areas like Video Accounts, the company’s short-form video product that has become a core use case within WeChat. Ranking and recommendation improvements drive increases in user engagement as well as advertising efficiency across the platform via better targeting and personalization. In addition, generative AI will make it easier for content creators and advertisers to create engaging content and advertisements, further increasing the monetization potential of its platform. As the most popular messaging app in China, WeChat also provides Tencent a massive distribution advantage that will enable it to quickly launch and scale any breakthrough generative AI products that might develop over time. One example is with search, where we think the company has an opportunity to leverage generative AI technology to gain substantial share in the search market.
Generative AI also has obvious applications in the company’s video game business. We expect Tencent will utilize generative AI to create more engaging video games by, for example, making non-player characters more interactive. In addition, generative AI will help reduce the cost and timelines for creating video game art and design assets (e.g. virtual worlds) which today is still a labor-intensive process. Similarly, Tencent should see cost and development time reductions when it comes to making long-form videos in its TV and movie studio business. Finally, as one of the leaders in China’s cloud computing market, the company also stands to benefit from its cloud customers building and adopting AI-based applications, which potentially could drive increased usage of Tencent’s cloud infrastructure offerings dramatically over time. With plenty of opportunities to enhance its business with AI, and no major businesses that look vulnerable to AI-driven disruption, Tencent looks like a clear AI winner across the board.
Samsung is another example of a global highly profitable technology leader that is positioned to reap major rewards from the AI opportunity while still trading at a very attractive valuation. As the largest semiconductor memory manufacturer, the largest mobile handset manufacturer and the number-two foundry business, Samsung has built a number of durable competitive advantages. Moreover, high-bandwidth memory (HBM) is proving to be a big opportunity given the memory-intensive demands of AI computing. Although SK Hynix—the world’s second-largest memory chipmaker and Samsung’s resurgent rival—has an early lead in HBM, we expect Samsung’s capacity and engineering scale eventually would help the company reassert its dominance in this fast-growing market.
Our investment in Tokyo Electron, the third-largest semiconductor equipment vendor, predates the investment mania surrounding GenAI, but AI’s emergence has proven to be an accelerant for the company’s leading-edge logic and memory tools. Expanding demand for advanced lithography has driven accelerating growth in the company’s coater/developer tools, a market that Tokyo Electron dominates, with 90% overall share. In the most advanced applications that require ASML’s leading-edge extreme ultraviolet lithography (EUV) the company has 100% share. New transistor structures and power-distribution systems will each draw heavily on Tokyo Electron’s batch processing and patterning tools to form these new complex features. And the die size of the individual tiles that form a GPU, for instance, continues to get larger, meaning that more production tools are necessary just to produce the same number of GPUs one generation to the next. GPU volume for training alone probably needs to more than double next year to train the 10 trillion parameters anticipated for OpenAI’s GPT5.
Tencent, Samsung and Tokyo Electron are all beneficiaries of the AI boom but their reasonable valuations do not build in the expectation of major AI contributions. In these early days of the AI industry’s development, we like these companies’ combination of an established profitable growing business with the opportunity to build a meaningful AI business over time.
Notes on Holdings:
Meituan
Meituan is China’s leading super app for local services with more than 700 million users annually. The company operates the go-to platform for local business search and discovery (e.g., restaurants, salons, spas, karaoke, etc.) built on user-generated reviews, ratings, photos/videos and recommendations. In addition, the company offers a range of other popular services such as food delivery, hotel booking, movie-ticket reservations and shared-bike rentals. Among its many products and services, food delivery is the most valuable because of its scale (nearly 20 billion orders amounting to about $130 billion in meals in 2023) and high user frequency (customers order 39 times per year on average). Based on its strong competitive position (about 70% market share), proven profitability and solid growth prospects, we believe Meituan owns the most attractive food-delivery business globally.
Outside of food delivery, the company’s local services marketplace business monetizes largely via commissions on in-store coupons, along with hotel bookings sold and advertising for increased merchant visibility in the app. Given Meituan’s well-known brand in local services and the low costs associated with running the platform, this business has been a major driver of profit growth since its initial public offering. However, during the last two years, the company has had to respond aggressively to competitive encroachment into the local services space by Douyin, China’s version of TikTok, which has resulted in slower profit growth for the business. We believe these profit growth headwinds will prove temporary and that both Meituan and Douyin will learn to share the market rationally over the long-term, with Meituan maintaining overall leadership and Douyin excelling in certain use cases and verticals that are better suited to its strength in livestreaming. Given the relatively low online penetration rate of local services, especially as compared to e-commerce, and the still attractive duopoly market structure going forward, we remain excited about Meituan’s long-term prospects in this business.
These near-term competitive concerns gave us an opportunity to substantially increase our position in Meituan at very attractive prices. Even after the 36% year-to-date stock price increase, we still find Meituan’s valuation attractive at 14x 2024 and 11x 2025 normalized owner earnings, given the company’s durable market position and management’s track record of strong execution and value creation. Beyond the competitive threat from Douyin, key risks we are closely monitoring include the potential for increased regulatory scrutiny, particularly as it relates to courier employment and benefits, and market saturation in food delivery caused by an inability to increase penetration among lower-income consumers.
Development Bank of Singapore
One of our long-held international investments is the Development Bank of Singapore (DBS), the largest bank in Singapore and one of the largest in Asia. With about 50% of the bank’s deposit base in low-cost current accounts and savings accounts, DBS has a significant advantage in the cost of funding. In addition to a retail customer base with strong brand loyalty, DBS has increased its competitive advantage and ability to attract low-cost deposits by offering sophisticated cash management services for corporate clients and by making wealth management a strategic focus for the bank. Through mergers and acquisitions (M&A) and organic growth, DBS has become one of the top-three banks in Asia for wealth management services. This business has been accretive to group return on equity (ROE) and is a natural fit to DBS’ structural advantages including domicile in a AAA-rated rule of law country and having Temasek, Singapore’s Sovereign Wealth Fund, as an anchor investor. Aside from its home market in Singapore, DBS is building its presence in Greater China (China, Hong Kong and Taiwan), India and Indonesia through M&A activity and measured organic growth. Management also had the foresight to see the threat from nontraditional competitors and has invested to make DBS one of the most technologically advanced banks globally.
We think its approach to digital banking will maintain the company’s competitive advantage in terms of efficiency and customer retention for the near future. We like their management and under the long-term CEO’s nearly 15-year tenure, DBS has delivered in excess of annualized 8% revenue growth, 11% net income growth and 11% total return for the stock. Their balance sheet remains robust (most recent capital ratio of 14.7% versus operating range of 12.5–13.5%) and has allowed for meaningful dividend increases and room for accretive deals.
DBS trades at around 10x estimated 2025 owner earnings, delivering a return on tangible equity in the high-teens and a 6% cash yield. Key risks would be structural weakness in regional trade flows and increased geopolitical tensions in the region.
Outlook
Global market returns over the past few years have been strong but often have been driven by a few large technology companies and we believe the appropriate focus now is on durability and resilience. Large government budget deficits and higher sovereign debt levels raises the risk of stubborn inflation and reduced government fiscal and monetary options in the future. Then, coupled with valuation levels well above historical averages raises the risk of market weakness.
Given the current economic and market backdrop, we believe DINT’s collection of competitively advantaged businesses with strong balance sheets and cash flow generation trading at a wide 41% discount relative to the MSCI ACWI ex US is well poised to generate good absolute and relative returns. The combination of market leaders in growing industries such as Samsung, Tencent (owned via Naspers/Prosus), Meituan, Sea Limited and Tokyo Electron, and attractively priced leading financial institutions like Danske Bank, Development Bank of Singapore, Julius Baer and Ping An Insurance in addition to durable industrials or mining companies such as Schneider Electric and Teck Resources creates an attractive portfolio on both a long- and shorter-term basis.
We understand that in uncertain times such as these, it is more important than ever to be able to entrust your savings to an experienced and reliable investment manager with a strong long-term record. During the 50 years since our firm’s founding, the Davis Investment Discipline has demonstrated an ability to generate above-average returns based on in-depth fundamental research and analysis, a long-term investment horizon and a strong value discipline. While times have changed, these fundamental principles are timeless and proven. We thank you for your continued trust and interest in DINT.
DINT Davis Select International ETF
Semi-Annual Review 2024
Managers