
Key Takeaways
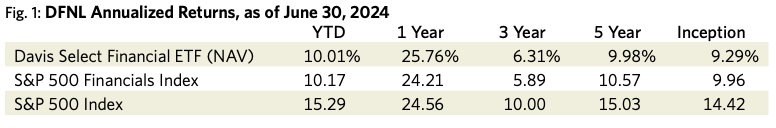
- The S&P 500 Index returned +15.29% in the first half of 2024. The S&P Financials Index lagged the broad index’s performance with a gain of +10.17%. DFNL returned +10.01% at NAV.
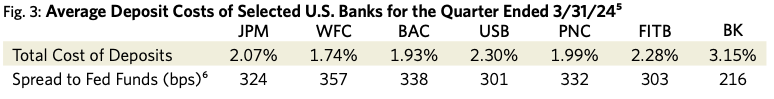
- U.S. banks’ strong profitability today is driven by the wide spreads they can earn on their low-cost deposit bases, which is a testament to the attractiveness and durability of their business model.
- We believe that the bank companies in our portfolio are well-positioned to withstand an eventual recessionary environment. Though short-term market fluctuations are unpredictable, our companies’ valuations are sufficiently low that we think they should be able to generate strong returns over the next decade.
The average annual total returns for Davis Select Financial ETF for periods ending June 30, 2024, are: NAV Return, 1 year, 25.76%; 5 years, 9.98%; Inception (1/11/17), 9.29%; Market Price Return, 1 year, 25.34%; 5 years, 9.90%; Inception, 8.51%. The performance presented represents past performance and is not a guarantee of future results. Investment return and principal value will vary so that, when redeemed, an investor’s shares may be worth more or less than their original cost. For the Fund’s most recent month end performance, visit davisetfs.com or call 800-279-0279. Current performance may be lower or higher than the performance quoted. NAV prices are used to calculate market price performance prior to the date when the Fund was first publicly traded. Market performance is determined using the closing price at 4:00 pm Eastern time, when the NAV is typically calculated. Market performance does not represent the returns you would receive if you traded shares at other times. The total annual operating expense ratio as of the most recent prospectus was 0.64%. The total annual operating expense ratio may vary in future years.
This material includes candid statements and observations regarding investment strategies, individual securities, and economic and market conditions; however, there is no guarantee that these statements, opinions or forecasts will prove to be correct. All fund performance discussed within this material are at NAV and are as of 6/30/24, unless otherwise noted. This is not a recommendation to buy, sell or hold any specific security. Past performance is not a guarantee of future results. There is no guarantee that the Fund performance will be positive as equity markets are volatile and an investor may lose money.
Strategy
Since its inception, DFNL has invested in durable, well-managed financial services companies at value prices, which the portfolio could hold for the long-term. Shelby Cullom Davis’s quip that financial services companies can be “growth companies in disguise” remains a bedrock tenet of our approach. Investors tend to place low valuations on financial companies because of their earnings volatility. But many financial companies generate capital through the business cycle at an attractive rate, which they use to pay dividends, buy back stock or otherwise deploy in ways that increase shareholder value.
Results
The S&P 500 Index returned +15.29% in the first half of 2024. Nvidia alone contributed almost 5 percentage points to that result, and several of its other large technology holdings also posted strong returns. The “Magnificent 7” tech stocks1 now sport a $16 trillion market capitalization and comprise approximately 33% of the index. In contrast, the equal-weighted S&P 500 Index increased by only +5.1%. As was the case in 2023, market leadership continues to be heavily concentrated in a handful of large technology companies.
The S&P Financials Index returned a gain of +10.17%, well off the pace of the S&P 500 Index but comfortably ahead of the equal weighted index. Large banks were an important driver of this outcome, while the regional banks included in the S&P Financials Index lagged the overall return and the S&P Banks Select Industry Index increased only +2.4%.2 Property and casualty insurance also contributed favorably to the S&P Financials Index return.
DFNL modestly underperformed the S&P Financials Index with a return of +10.01%. Our biggest contributors to relative performance were our large bank holdings (Wells Fargo, JP Morgan Chase and Bank of America), American Express, BNY Mellon and selected international banks (DBS Group and Danske Bank). The portfolio’s largest relative detractors were from regional banks (U.S. Bancorp, PNC Financial and Fifth Third Bank) and selected consumer finance companies (Capital One and Rocket Companies).
Portfolio Positioning
Banks, globally and broadly defined—including trust banks and wealth-management firms taking on-balance-sheet client deposits but little credit risk—continue to make up approximately 70% of DFNL. While the stock prices of our bank holdings have by and large fully recovered (and then some) from the drawdown in early 2023 precipitated by the failure of Silicon Valley Bank, we remain optimistic about their potential returns from here. We have frequently noted in these letters that we think many investors remain leery of financial stocks and banks in particular with memories of the 2008–09 financial crisis still vivid, and we continue to believe that today. In addition, we believe the nuances of this interest rate cycle, when combined with the way that generally accepted accounting principles (GAAP) reports interest income (and therefore net earnings) fails to capture just how profitable the banking business is today. Figure 2 from PNC Financial, one of our significant bank holdings, illustrates this point well.
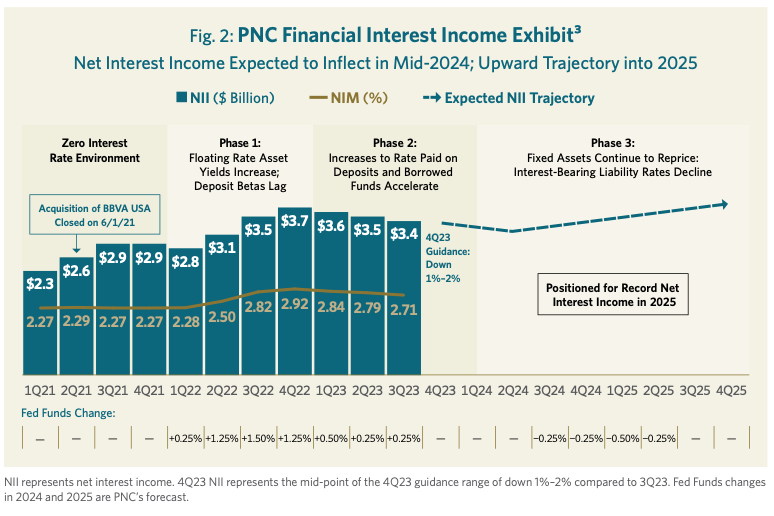
In the first phase of the interest rate cycle, interest income rises quite sharply as a bank’s floating rate assets (e.g. deposits at the Federal Reserve, floating rate loans, etc.) reprice up immediately, but the cost of its customers’ deposits do not increase right away. At PNC Financial, this resulted in a trough-to-peak increase of +31% through the fourth quarter of 2022; a similar spurt was experienced by our other bank holdings generally. But the stickiness of deposit funding is, in part, just a timing phenomenon. Eventually customers—whether institutional, commercial or retail—start to respond to the changed interest rate environment, and will seek out higher-yielding cash alternatives if their bank does not offer a sufficient return.
In the second phase, when the pace of benchmark interest rate increases slows (or stops), a bank’s lagging increases in deposit funding costs more than offset any benefit from increased asset yields, and the level of net interest income (NII) begins to erode from the initial peak level. The industry is now firmly settled in the midst of this second phase, with substantially all of our U.S. bank holdings experiencing sequential declines in net interest income. While it is fair to assume that there will still be some room to run with respect to the repricing (or remixing) of deposits, given that interest rates have been steady for the best part of a year now, this trend seems to have largely run its course.
The third phase of this trajectory should be the one that long-term investors in bank stocks care about most. In this phase, the bank’s fixed rate assets—which were generally put on the books during the prior period of low interest rates—will begin to mature and roll over into new loans and securities at the current level of medium- and long-term benchmark interest rates. There will be another inflection point once the reinvestment of maturing assets dominates the remaining lag in deposit cost repricing. Whether this inflection point occurs in the second quarter of this year or the first quarter of next year is of little consequence compared to the fact (all else equal) that it will occur. Based on the interest rate outlook at the time, PNC was sufficiently confident to share with investors its projection that it would earn record net interest income in 2025. If hypothetically PNC had generated interest income in its most recent quarter at its prior peak level in 4Q22, its net earnings would have been higher by approximately +25%, its return on tangible capital would have been approximately 15% despite currently holding excess capital and its price/earnings multiple would have been 10x.4
Another way of looking at this is to say that banks are far more profitable today on market terms than their reported GAAP results suggest, as their interest income is weighed down by their “legacy” fixed rate asset decisions. This is not to dismiss the consequences for intrinsic value of those decisions, but it does make us feel very good about the economics of the underlying franchises we own. This is all driven by the wide spreads that U.S. banks continue to earn on their customers’ deposits (see Figure 3). Hypothetically, most banks could improve their run-rate of reported net income meaningfully—with no change to their risk profile with respect to credit or duration—by realizing the mark-to-market losses on their available-for-sale securities and immediately reinvesting into similar securities at today’s yields.7 This would of course result in recognizing a significant up-front loss-on-sale through the income statement, but there would be no impact on their GAAP shareholders’ equity, nor would there even be a capital impact for the largest banks which already reflect such mark-to-market losses in their regulatory measures. We are not believers in our companies taking actions solely for the accounting treatment;8 the point here is just to illustrate how strongly banks’ deposit franchises are performing today.
Despite the strong absolute returns generated by DFNL in 2023 and so far in 2024, we continue to view our holdings, particularly our bank positions, as quite attractively valued. Eight of our largest U.S. bank holdings9 are valued in aggregate at 1.7x tangible book value. These companies are expected to earn a 14% return on equity (ROE) in 202410 and would be earning higher returns if their fixed rate assets were reflected at market yields, although these banks arguably are “over-earning” modestly as credit has yet to normalize fully. But we believe this group should be able to earn a mid-teens ROE on average and over time.
Conclusion
We remain consistent in our approach to allocating capital in our portfolio. We look for companies with durable competitive advantages coupled with competent and honest managements that are priced at a discount to their intrinsic value. We invest presuming that we will own our companies through various business cycles. We do not attempt to build a portfolio around a particular speculative forecast—by trying to predict where interest rates or the economy will go, for example. Rather, we strive to construct a portfolio that will perform well over the long term across a range of economic outcomes. As such, our portfolio is diversified across leading franchises earning above-average returns on capital in banking, payments, custody, wealth management and property and casualty insurance.
We don’t pretend to know the future direction of macroeconomic variables, and would still consider a recession in the next year or two as quite plausible. However, we believe that banks—especially the banks in our portfolio—are well-positioned to withstand a recessionary environment, if that should occur. And, despite the recovery in stock prices in the last months of 2023 and so far in 2024, we believe our companies’ valuations remain low enough to generate strong returns over the next decade.
We remain excited by the investment prospects for the companies in DFNL. Nothing provides a stronger indication than the fact that the Davis family and colleagues have a meaningful investment in the portfolio alongside our clients. We are grateful for the trust you have placed in us.
DFNL Davis Select Financial ETF
Semi-Annual Review 2024
Managers