
Key Takeaways
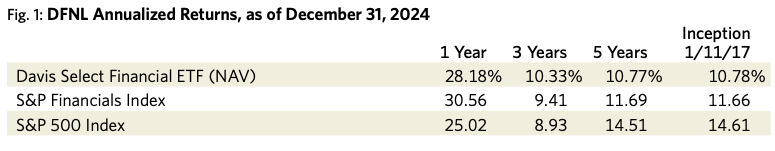
- The S&P 500 Index returned +25.02% for the full year 2024. The S&P Financials Index exceeded the broad index’s performance with a gain of +30.56%. Davis Select Financial ETF (DFNL) returned +28.18% during this period.
- Stock valuations overall have increased given the S&P 500 Index’s strong performance but there remains a significant dispersion among them. This may be most apparent in the valuations of large U.S. technology companies, but is also noticeable within the Financials Index. The companies in DFNL are valued in aggregate at a significant discount to the overall market.
- We believe that our portfolio companies are well-positioned to withstand an eventual recessionary environment. Though short-term market fluctuations are unpredictable, our companies’ valuations are sufficiently low that we think they should be able to generate attractive returns over the next decade.
The average annual total returns for Davis Select Financial ETF for periods ending December 31, 2024, are: NAV Return, 1 year, 28.18%; 5 years, 10.77%; Inception (1/11/17), 10.78%; Market Price Return, 1 year, 28.58%; 5 years, 10.89%; Inception, 10.84%. The performance presented represents past performance and is not a guarantee of future results. Investment return and principal value will vary so that, when redeemed, an investor’s shares may be worth more or less than their original cost. For the Fund’s most recent month end performance, visit davisetfs.com or call 800-279-0279. Current performance may be lower or higher than the performance quoted. NAV prices are used to calculate market price performance prior to the date when the Fund was first publicly traded. Market performance is determined using the closing price at 4:00 pm Eastern time, when the NAV is typically calculated. Market performance does not represent the returns you would receive if you traded shares at other times. The total annual operating expense ratio as of the most recent prospectus was 0.64%. The total annual operating expense ratio may vary in future years.
This material includes candid statements and observations regarding investment strategies, individual securities, and economic and market conditions; however, there is no guarantee that these statements, opinions or forecasts will prove to be correct. All fund performance discussed within this material are at NAV and are as of 12/31/24, unless otherwise noted. This is not a recommendation to buy, sell or hold any specific security. Past performance is not a guarantee of future results. There is no guarantee that the Fund performance will be positive as equity markets are volatile and an investor may lose money.
Strategy:
Growth in Disguise
DFNL invests in durable, well-managed financial services companies at value prices, which the portfolio could hold for the long-term. Shelby Cullom Davis’s quip that financial services companies can be “growth companies in disguise” remains a bedrock tenet of our approach. Investors tend to place low valuations on financial companies because of their earnings volatility. However, many financial companies generate capital through the business cycle at an attractive rate which they use to pay dividends, buy back stock or otherwise deploy in ways that increase shareholder value. By focusing on economic reality rather than investor sentiment, DFNL has compounded shareholder wealth at +10.78% annually since its inception in January 2017.
2024 Results:
Second-Half Strength
The S&P 500 Index returned +25.02% for the full year 2024. The breadth of stock market performance improved in the second half of 2024 compared with earlier periods but overall annual performance continued to be heavily driven by the index’s large technology stocks. Nvidia alone contributed greater than 5 percentage points to that result and several of the index’s other large technology holdings also posted strong returns. The “Magnificent 7 plus 1” tech stocks1 now collectively sport a $19 trillion market capitalization, comprise approximately 36% of the S&P 500 Index, and returned in aggregate approximately +51% in 2024. In contrast, the equal-weighted S&P 500 Index increased by only +12.98%. As was the case in 2023, market leadership continues to be heavily concentrated in a handful of large technology companies.
The S&P Financials Index returned a gain of +30.56%, ahead of both the S&P 500 Index and the equal-weighted index. The Financials Index lagged the S&P 500 Index through the first half of the year but started to outperform in the latter part of the summer and into the fall, and then spiked up immediately after the U.S. elections in November. The strongest market performance was in large banks (including the investment banks), consumer finance firms, alternative investment managers and financial software companies. Payment networks, financial data providers and exchanges lagged.
DFNL returned +28.18% during this period (see Figure 1). The biggest contributors to our relative performance were our large bank holdings (Wells Fargo and JP Morgan Chase), our consumer finance holdings (Capital One and American Express) and BNY Mellon. The portfolio’s largest detractors were property and casualty insurers (Markel, Chubb, Loews and Everest Group), selected international banks (Danske and DNB), mortgage originator Rocket Companies and Julius Baer.
Market Environment:
Valuation Dispersion
The stock price performance of U.S. markets has been quite strong in each of the last two years. For our financial company holdings we would largely attribute this to the absence of bad news and the waning of the cloud of pessimism that hung over financial stocks at the outset. Over this two-year period we saw annual U.S. GDP growth of 2.9%, an unemployment rate that has edged up but remains low by historical standards at 4.1%, and a rate of inflation that has been reined in from the higher levels seen in 2021–2022 (although remains stubbornly above the Fed’s 2% target). At banks specifically, credit losses are “normalizing” upward but similarly remain at modest levels in aggregate (inclusive of losses taken on commercial office real estate). Deposit balances have stabilized and the spread between deposit costs and market yields remains quite attractive. There is also an improving outlook on pending regulatory capital rule changes. So despite the stress put upon the financial system by the failure of Silicon Valley Bank and others in early 2023, the environment has turned out to be conducive to attractive profitability at banks, insurers and capital markets players generally.
However, stock prices have certainly increased much more than the growth in earnings, resulting in higher valuation multiples for stocks, broadly, and for financial companies as well. As shown in Figure 2, the S&P 500 Index was trading for 24.9x current year earnings at the end of 2024, an increase of approximately seven points since the beginning of 2023. This trend has been heavily influenced by those eight large technology companies which collectively are valued at approximately 36x earnings. However, that would still imply a multiple of roughly 19x for the rest of the S&P 500 Index, which is not low by historical standards.2
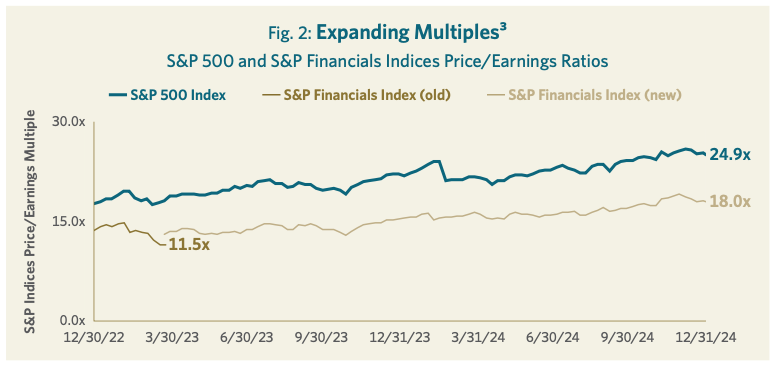
The S&P Financials Index was trading at an 18x multiple at year-end (see Figure 2), approximately four points3 above where it was at the start of 2023. In fairness, this was skewed by S&P Global’s reconstitution of the Financials Index in March of 2023, including the notable additions of payment network companies Visa and Mastercard which justifiably trade at higher multiples than the typical financial company. Nonetheless, it remains fair to say that there has been multiple expansion among financial companies too, albeit not to the degree seen in the broader market index.
There is a significant dispersion of valuations within the Financials Index (albeit perhaps not quite of the same magnitude as in the broader index). Approximately 39% of the companies in the Financials Index (weighted by market capitalization) traded at multiples higher than 22x 2024 earnings at the end of the year (see Figure 3), and their weighted average multiple was 28x.4 Included in this group were the payment networks, alternative asset managers, financial data companies, financial software providers, insurance brokers and exchanges. Many of these are very high quality companies whose business models and management teams we admire. Stocks trading at such valuations can still be very compelling investments depending on their growth trajectory and the economics of their business, in which case we would happily be (and are) shareholders. Each of these companies has a story, and some of them might even come true. However, in our experience, for the vast majority of these companies to all grow into such a rich valuation represents an extremely high degree of difficulty.
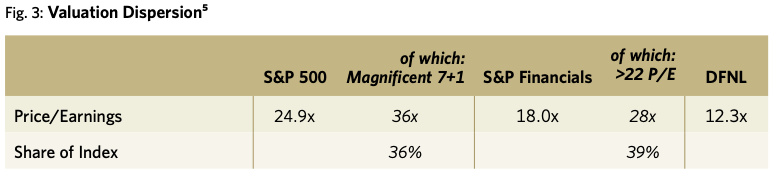
The companies held in DFNL skew toward the types of businesses that make up the other 61% of the Financials Index, namely U.S. money center and regional banks, consumer finance companies, property and casualty insurers, wealth managers and foreign banks. These companies are more balance sheet-intensive and should earn lower returns on capital. They bear credit and underwriting risk so their returns can be lumpy (though that isn’t necessarily negative: regular readers of these letters may recall that we often say we prefer “a lumpy fifteen to a smooth twelve”). They are regulated. These companies should trade at a valuation discount but with the portfolio’s weighted average P/E multiple at an estimated 12.3x5 we believe both that the discount is too wide and that the prospective absolute returns on our portfolio from here should be more than satisfactory.
Some simple growth math can illustrate this point. The companies in our portfolio generate a weighted average return on tangible equity of approximately 15%.5 If a hypothetical company earning that return and trading at a similar 12.5x multiple could grow its income at a 3% annual rate, the total annual investment return to its shareholders would actually be +9.8% (see Figure 4), with 80% of its earnings available for distribution in the form of dividends and share repurchases.6
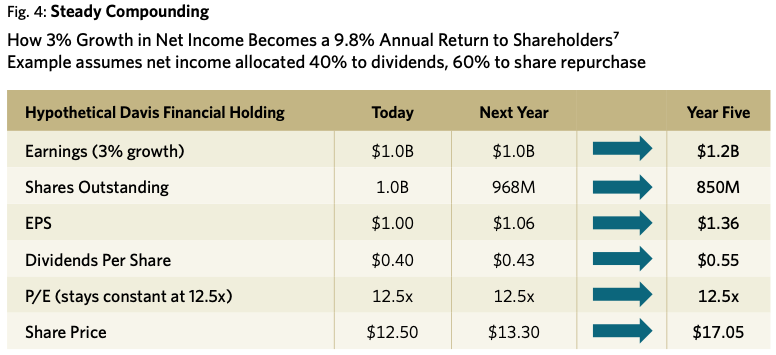
For the companies in our portfolio this level of growth is not that high of a bar, in our view. Moreover a portion of that growth is already “baked in” (all else equal) given that interest and investment income at our banks and insurers should continue to benefit from the repricing of their fixed rate bonds to current market yields as they mature, and because many of our banks currently are holding capital in excess of what they are likely to need when the regulatory capital rules are eventually finalized.
We don’t pretend to know the future direction of macroeconomic variables and would still consider a recession in the next year or two as quite plausible. However, we believe that the companies in our portfolio are well-positioned to withstand a recessionary environment if and when that should occur. We also believe that despite the recovery in stock prices in the last months of 2023 and in 2024 our companies’ valuations remain low enough to generate attractive returns over the next decade.
Representative Holdings
We are always mindful of John Train’s adage that “investing is the art of the specific.” Capital One is our largest holding. Best known as an issuer of credit cards, the company also is a leading player in auto financing and “direct” consumer deposit banking, and participates in commercial banking. Capital One continues to be led by its founder, Richard Fairbank, who brought to market a data- and technology-driven model that was revolutionary in consumer financial services at the time. While competitors have since emulated much of this model, we believe the company continues to be on the front foot.
Over the last decade, Capital One has grown its U.S. credit card loans and payment volumes annually at 7% and 12%, respectively, gaining share from its competitors. Importantly, it has been an astute manager of the credit cycle and has shown conservatism in its accounting for loss reserves. Earnings can admittedly be volatile from period to period but it is noteworthy that Capital One has never once in its history experienced a four-year period in which it did not earn at least a 13% return on tangible common equity. The company is valued at 12x its Owner Earnings,8 and is currently holding significant excess capital (awaiting clarity on pending rule changes, and on a regulatory decision regarding its pending merger with Discover Financial) that we believe will accelerate per share earnings growth in the coming years.
Julius Baer, another representative holding in the portfolio, is the leading pure-play private bank in the world, focusing exclusively on providing wealth management services to high and ultra-high net worth individuals. While the DNA of this 130-year-old private bank is Swiss, it serves clients globally and currently manages over CHF (Swiss Franc) 480 billion in assets. It is a durable, high-touch business driven by relationships and supplemented by technology and investment capabilities. Julius Baer is a rare combination of a business with modest growth and high returns. Over the last decade revenue has compounded at 6% annually and Owner Earnings at 8%, generating returns on tangible equity north of 30%. Julius Baer is currently trading at only 11x forward earnings, substantially all of which is available for dividends, buybacks and disciplined M&A.
Outlook:
Durable Across Outcomes
We remain consistent in our approach to allocating capital in our portfolio—that is, we look for companies with durable competitive advantages coupled with competent and honest managements that are priced at a discount to their intrinsic value. We invest presuming that we will own our companies through business cycles. We do not attempt to build a portfolio around a particular speculative forecast—for example, by trying to predict where interest rates or the economy will go. Rather, we strive to construct a portfolio that will perform well over the long term across a range of economic outcomes. As such, our portfolio is diversified across leading franchises earning above-average returns on capital in banking, payments, custody, wealth management, and property and casualty insurance. We remain excited by the investment prospects for the companies in DFNL.
We have navigated a constantly changing investment landscape guided by one North Star: to grow the value of the funds entrusted to us. We are pleased to have achieved strong results thus far and look forward to the decades ahead. With a meaningful investment alongside more than $2 billion of our own money invested in our portfolios, we stand shoulder to shoulder with our clients on this long journey.9 We are grateful for your trust and believe we are well-positioned for the future.
DFNL Davis Select Financial ETF
Annual Review 2025
Managers